Loading photograph
Preparing the 3D view
Preparing lighting and the first complete frame…
Model scale
Two 20 × 10 m plots. surface lowering ×30. enlarged process tracers.
Model minute 24.0 · bare export 404 kg / mean loss 1.83 mm · comparison export 404 kg / mean loss 1.83 mm.
How to read these results
Invented 6000 kg active layer per plot: remaining + in transport + exported stays constant. Rain detachment and runoff-transport example; blue routes indicate concentrated flow, not calculated rill depths. Vegetation changes a disclosed coefficient; neither soil loss nor protection is a site prediction.
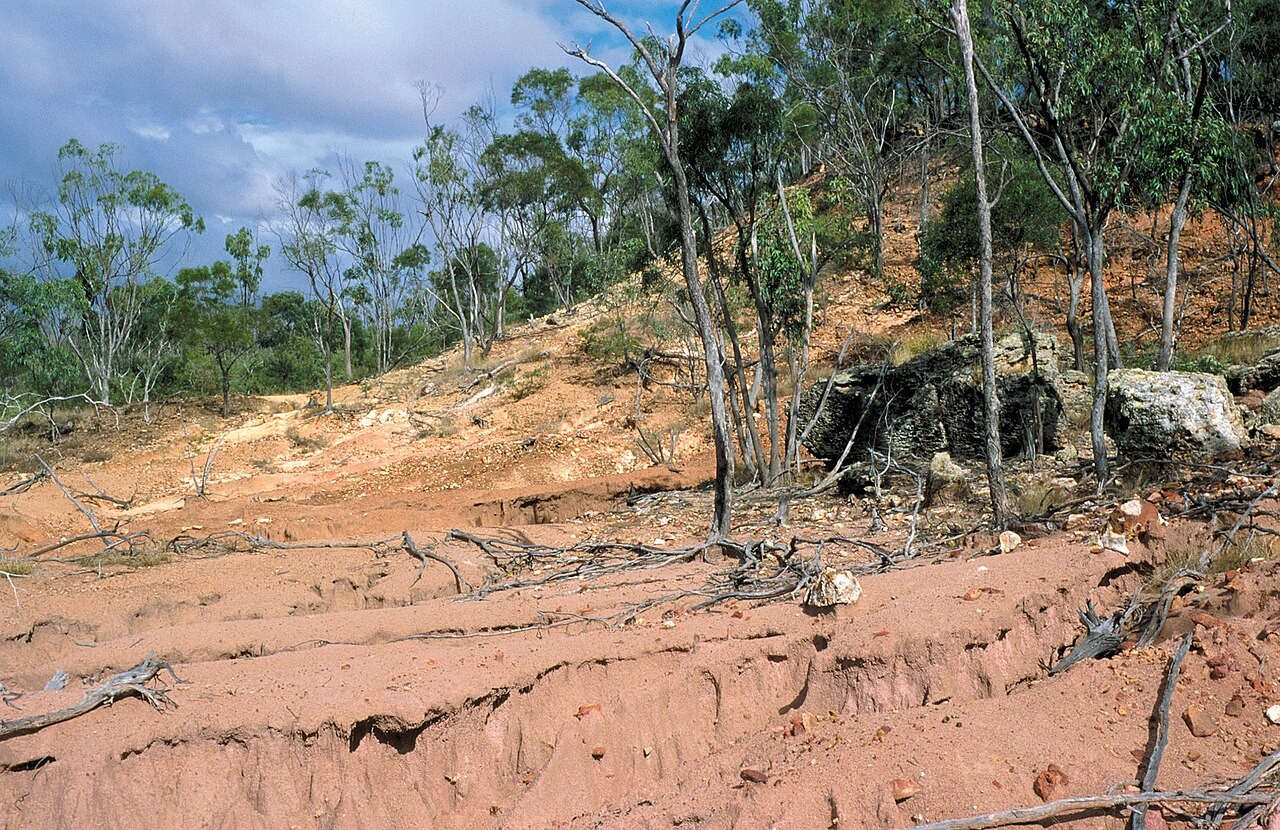
Soil erosion
Compare soil loss under different vegetation cover and explain how runoff carries sediment away from a slope.
Drag to rotate. Hold Ctrl and scroll to zoom, or pinch on a touch screen.