Skip to content

417 words used in the labs.

Find a term from the labs, understand the process behind it, and see how it appears in the landscape. Each entry connects an explanation with a real observation and a model you can explore.

0 / 417 marked understood · saved on this device

417 matching terms

The mineral soil layer near the surface, where organic matter mixes with sand, silt and clay. Its darker colour often reflects humus, but colour alone does not establish fertility or the depth of the layer.

What to look for

Calciustoll near Ponce, Puerto Rico: a Mollisol with a roughly 30 cm mollic surface over a calcic horizon. Its parent material includes colluvium and weathered limestone.
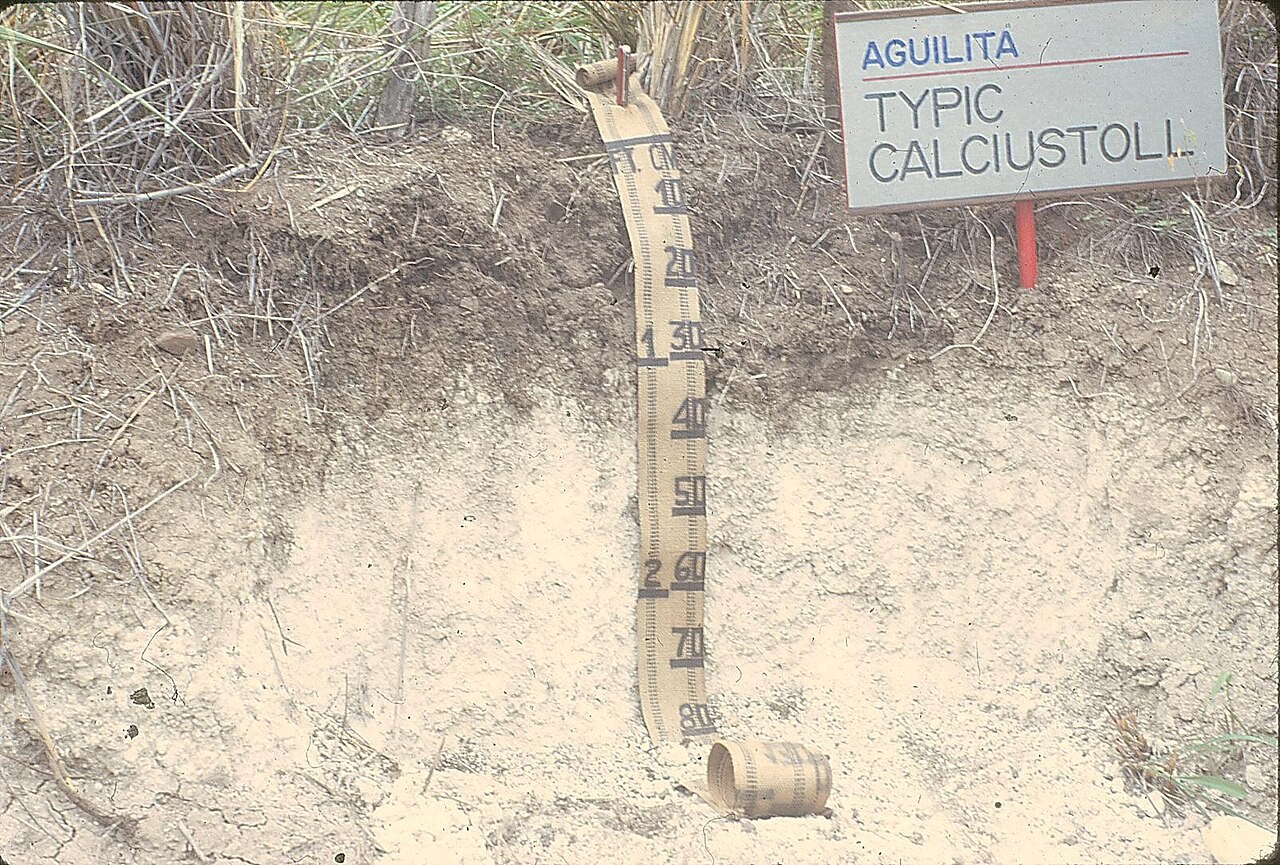
A Puerto Rican soil profile has a dark surface above pale carbonate-rich subsoil, with a depth scale.
Loading photograph
Read and share term →

Corrasion

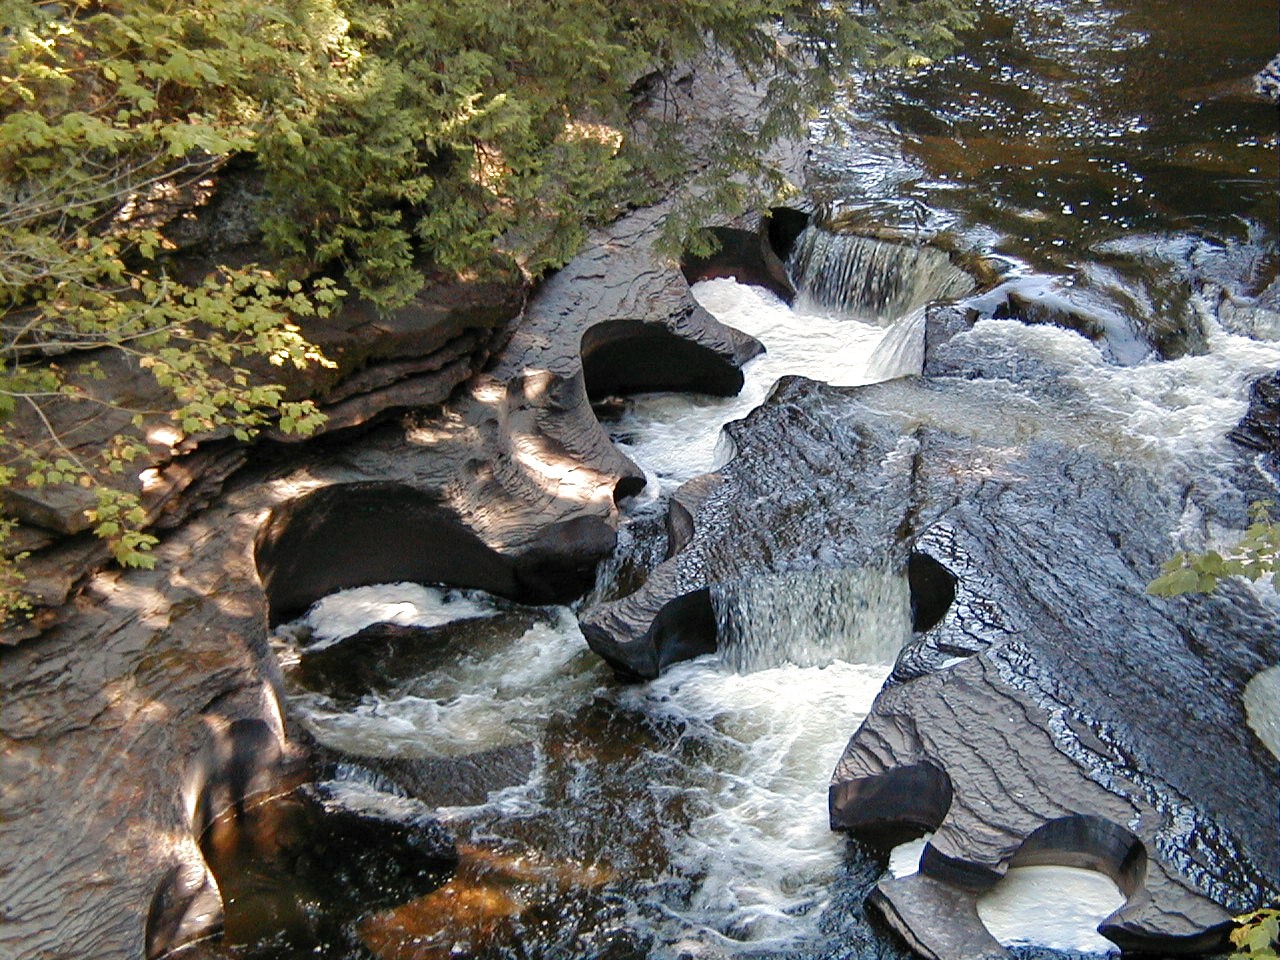
The wearing away of rock by sediment carried against it by water, wind or ice. Look for scratches, polished surfaces or potholes. Unlike attrition, abrasion describes damage to the surface being struck, rather than collisions between transported particles.

What to look for

Presque Isle River, Michigan. Sediment circulating in eddies abrades the bedrock, enlarging these potholes.

Rounded potholes cut into dark bedrock beside flowing water in the Presque Isle River, Michigan.
Loading photograph
Read and share term →

The transfer of radiation into a material, increasing its internal energy. Dark ground often absorbs more sunlight than bright snow. Absorption differs from reflection, which sends radiation away, and transmission, which lets it pass through.

What to look for

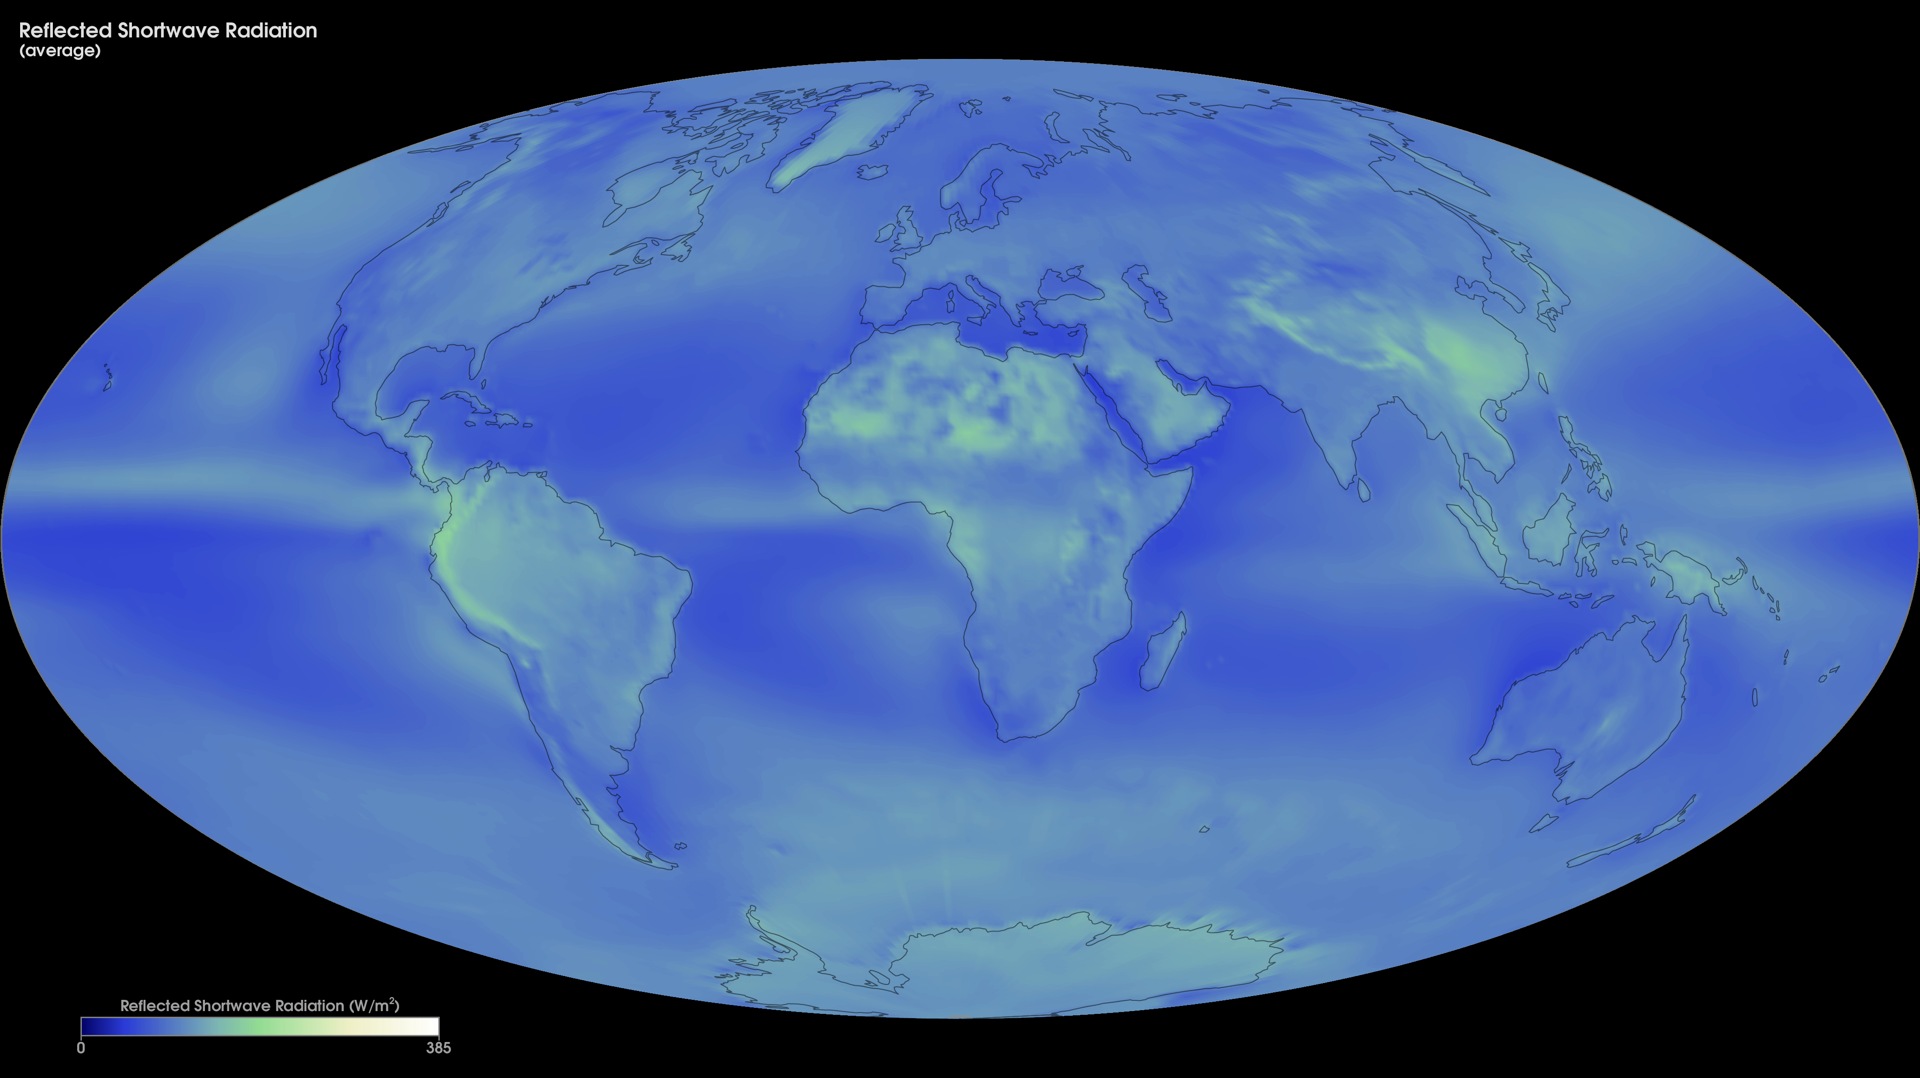
This CERES observation maps reflected sunlight. Solar absorption by the Earth system is the incoming shortwave energy minus this reflected component; the image measures reflection rather than absorption directly.

NASA CERES map of reflected shortwave radiation averaged over 2000–2015, with a 0–385 W m⁻² colour scale.
Loading photograph
Read and share term →

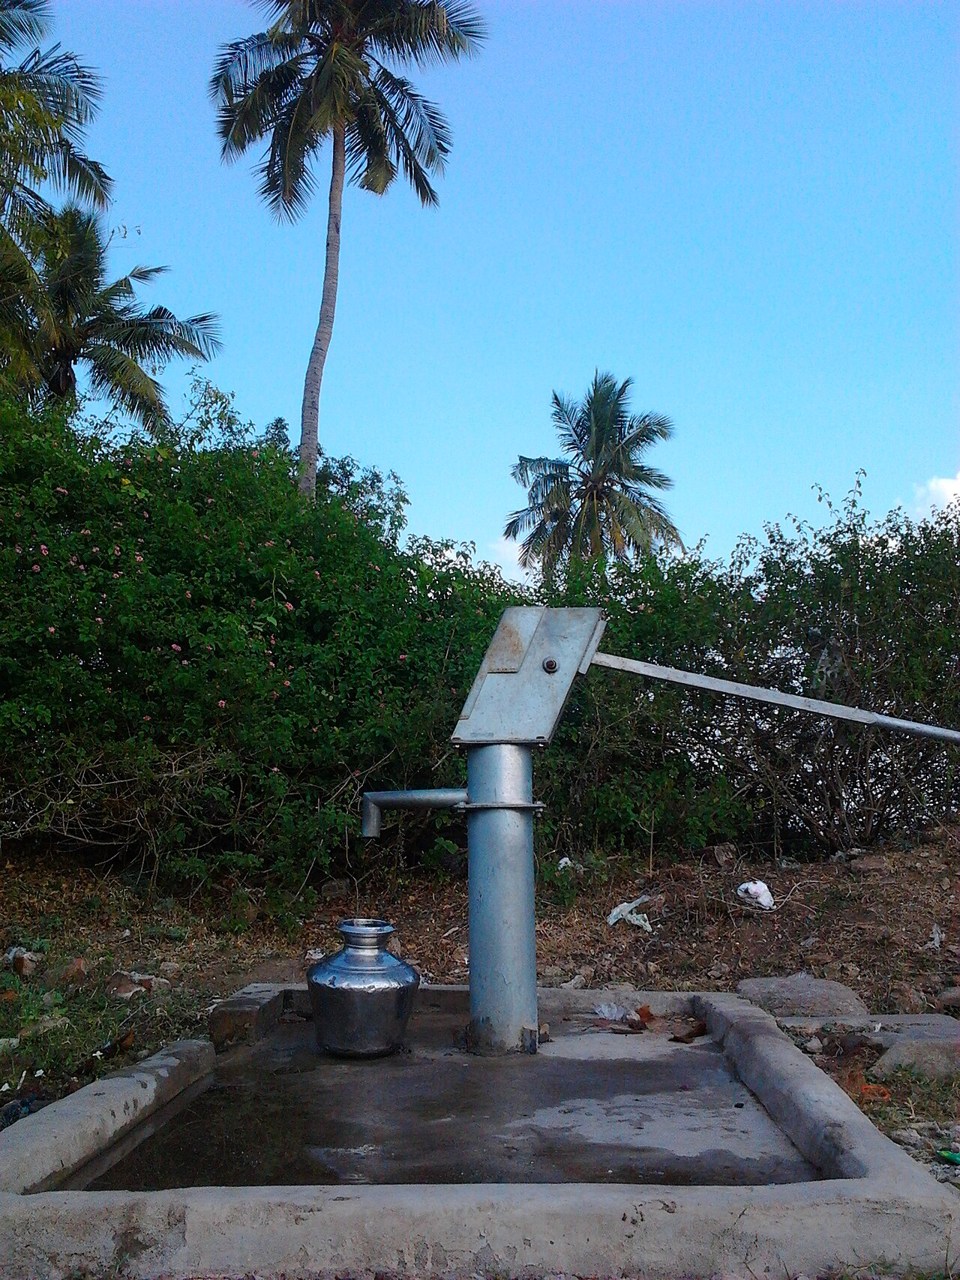
The removal of water by people from a river, lake or aquifer for uses such as irrigation or drinking supplies. A store can shrink when abstraction and other losses exceed recharge, even though water continues circulating globally.

What to look for

Groundwater hand pump at Perambalur, India. Abstraction removes water from an aquifer; pumping may lower the water level around a well, which is measured below ground.

A hand pump used to draw groundwater at Perambalur, India.
Loading photograph
Read and share term →

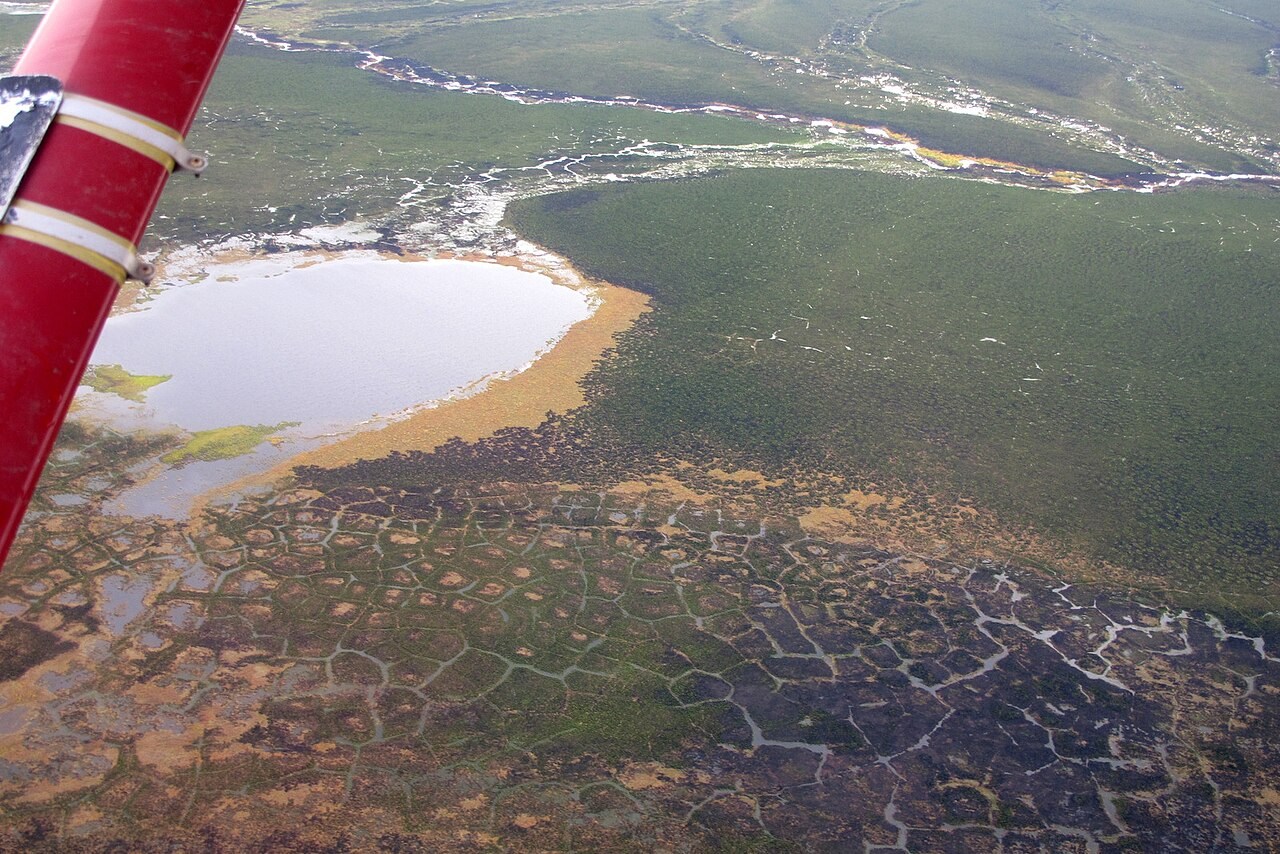
The ground above permafrost that thaws in summer and freezes again in winter. Its thickness changes with local climate, vegetation and soil. Seasonal thaw of this layer does not necessarily mean that the underlying permafrost has disappeared.

What to look for

Patterned ground in Alaska's Noatak region. The active layer above permafrost thaws and refreezes seasonally; surface patterns show freezing processes, but active-layer depth needs field measurements.

Polygonal ground and ponds on the tundra in Noatak National Preserve, Alaska, photographed from the air.
Loading photograph
Read and share term →

Cooling as an air parcel expands when pressure falls, without exchanging heat with its surroundings. Rising air commonly cools this way.

What to look for

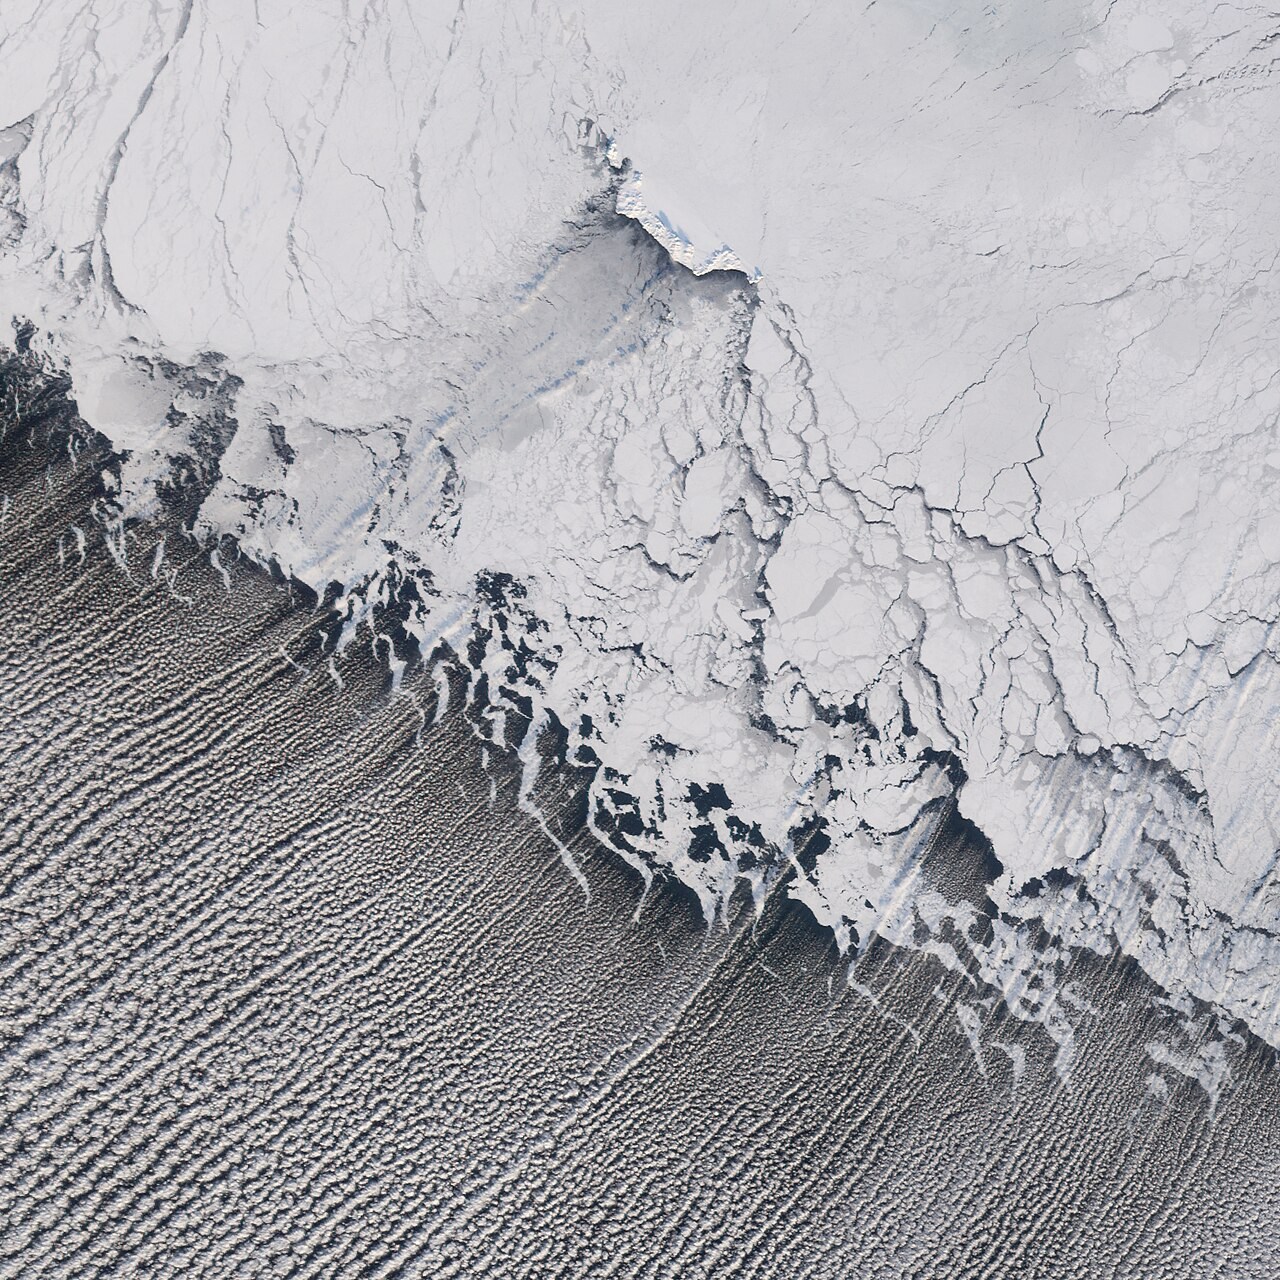
Cloud streets over the Bering Sea, 20 January 2006. Cold air over warmer water supports convection organised into rolls by the wind.

Parallel rows of clouds extend from sea ice across open water in the Bering Sea.
Loading photograph
Read and share term →

Köppen tropical rainforest climate: every month averages at least 18 °C and receives at least 60 mm of precipitation.

What to look for

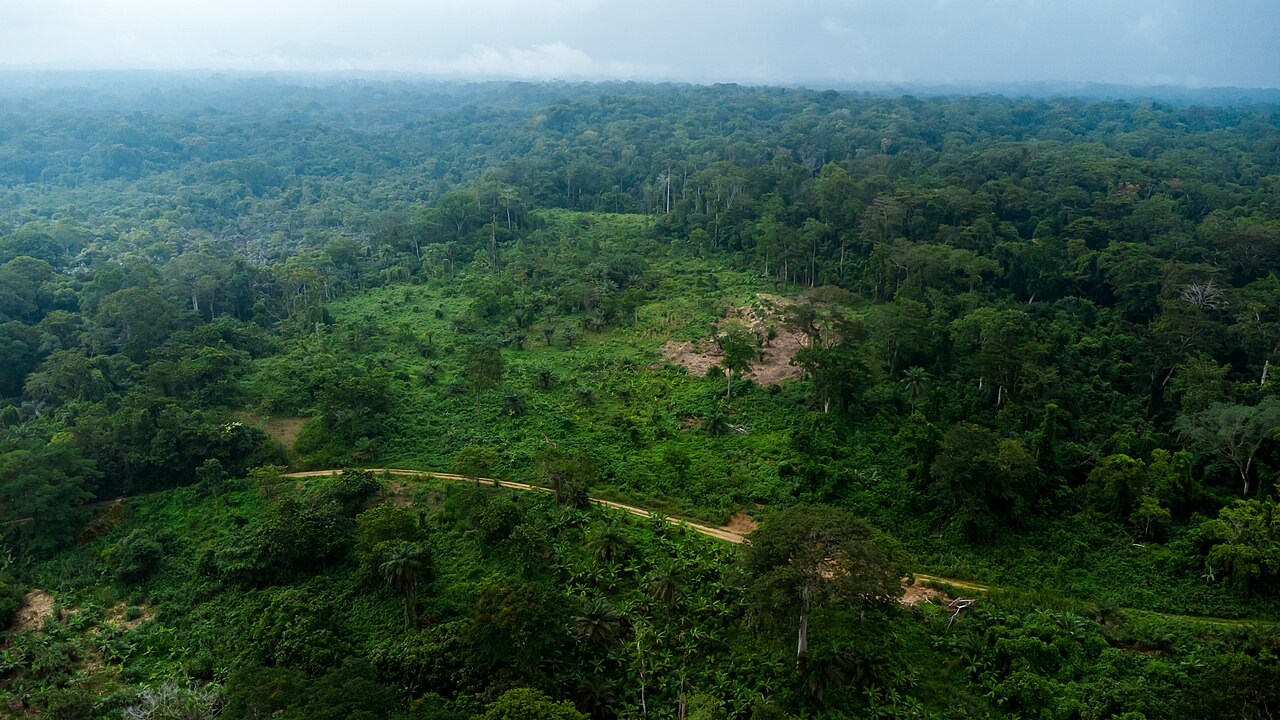
Tropical forest at Bodiman, Cameroon. This is a landscape example for tropical rainforest climate; an Af classification is determined from long-term monthly temperature and rainfall, not from vegetation alone.

Dense green tropical forest canopy at Bodiman, Cameroon.
Loading photograph
Read and share term →

Volcanoes that get older away from the active centre, recording plate motion.

What to look for

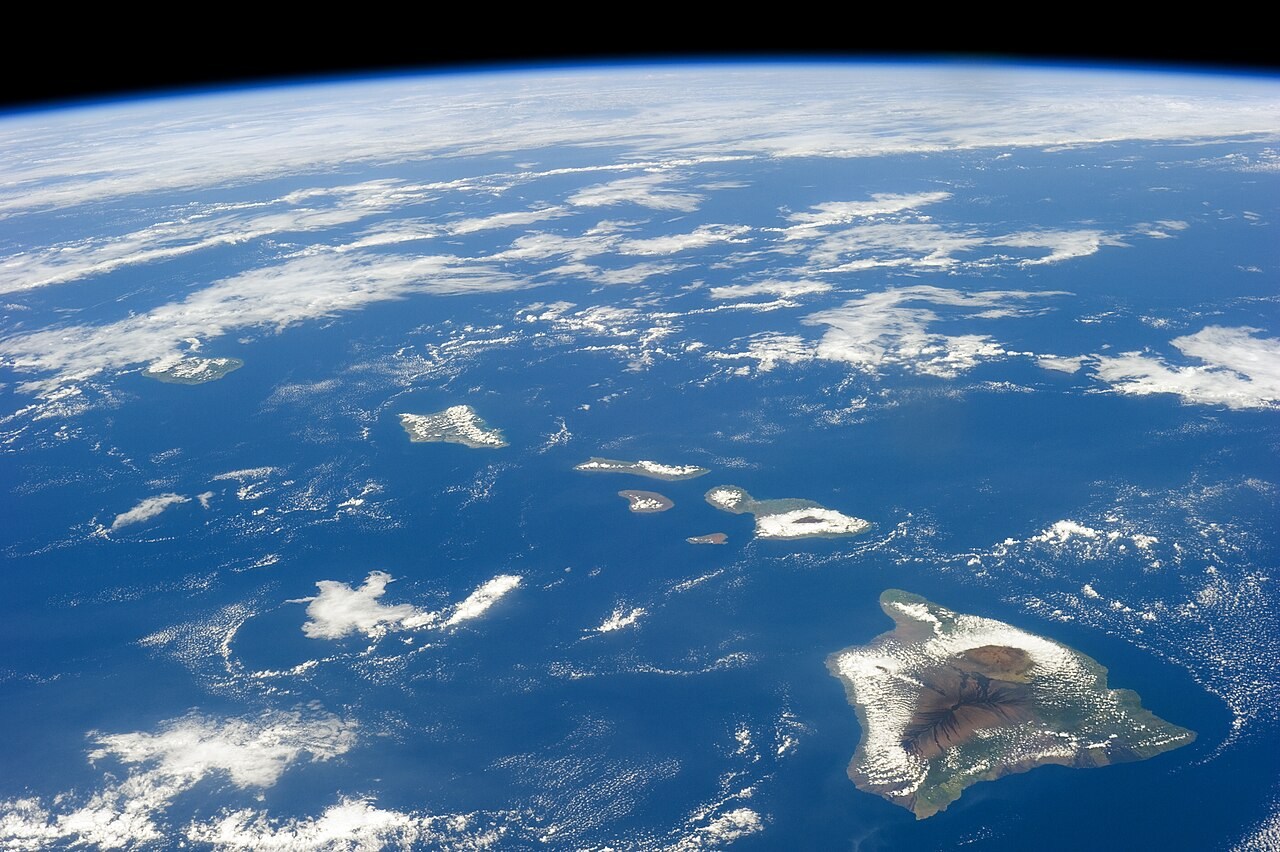
Hawaii from the ISS. The volcanic chain records Pacific plate motion relative to a long-lived hotspot; the youngest main island is at the southeast end.

The Hawaiian volcanic islands stretch across the Pacific beneath scattered white clouds in an ISS photograph.
Loading photograph
Read and share term →

A large body of air with broadly similar temperature and moisture characteristics acquired over a source region.

What to look for

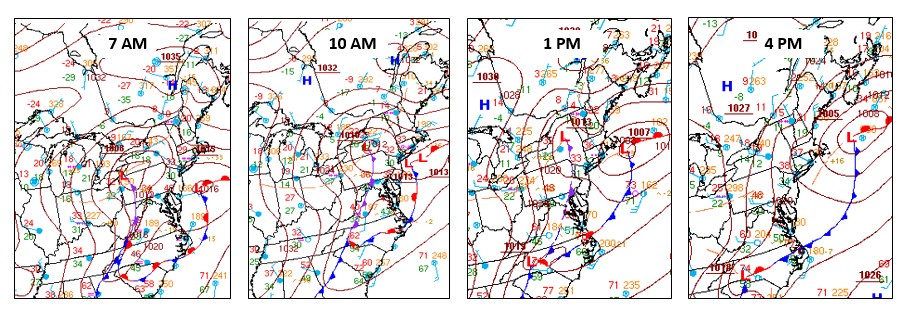
NOAA surface analyses during a late-February 2022 storm. Isobars join equal pressure; front symbols identify analysed boundaries between air masses.

Four NOAA surface analysis charts show pressure contours and weather fronts during a North American storm.
Loading photograph
Read and share term →

The fraction of incoming sunlight reflected by a surface, expressed from zero to one or as a percentage. Fresh snow usually has a high albedo and dark soil a lower one. Reflected energy in watts per square metre is a flux, not albedo itself.

What to look for

CERES measures reflected shortwave energy in W m⁻². Albedo is the fraction of incoming sunlight reflected, so obtaining it requires dividing reflected flux by the corresponding incoming flux; the colour scale here is not albedo.

NASA CERES map of reflected shortwave radiation averaged over 2000–2015, with a 0–385 W m⁻² colour scale.
Loading photograph
Read and share term →

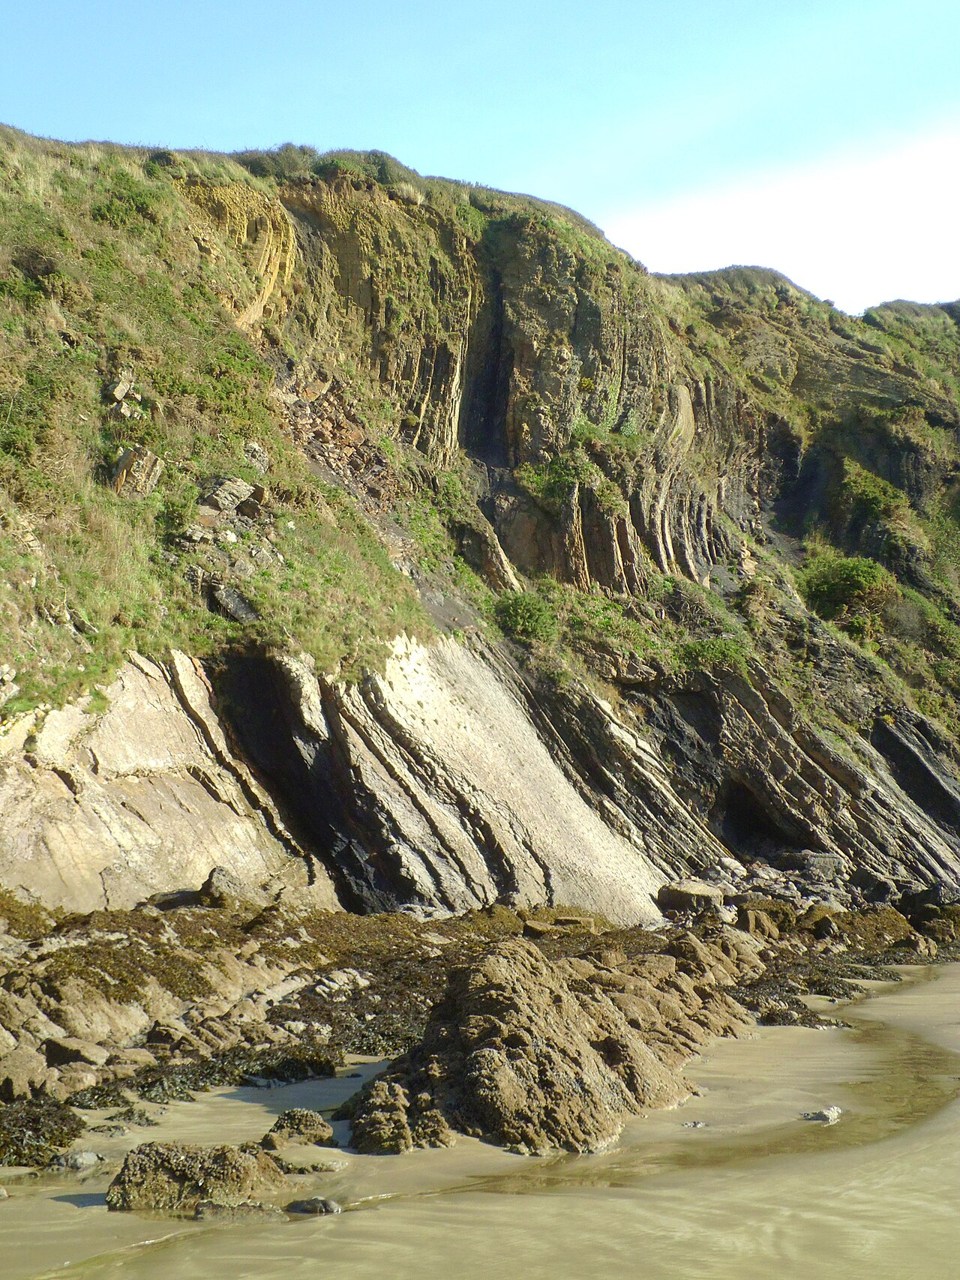
A fold with the oldest rocks in its core. In a simple upright anticline, the layers arch upwards and dip away from the centre; overturned folds can have different geometry.

What to look for

Folded strata at The Settlands, Wales. Trace a bed through the exposure to see deformation recorded in solid rock.

Tilted and folded sedimentary beds exposed at The Settlands coast.
Loading photograph
Read and share term →

An atmospheric circulation around a region of high pressure, commonly associated with sinking air. Surface winds turn clockwise in the Northern Hemisphere and anticlockwise in the Southern Hemisphere. Clear skies are common, but fog and low cloud can persist.

What to look for

NOAA surface analyses during a late-February 2022 storm. Isobars join equal pressure; front symbols identify analysed boundaries between air masses.

Four NOAA surface analysis charts show pressure contours and weather fronts during a North American storm.
Loading photograph
Read and share term →

Explore further with USGS water glossary · USGS volcano glossary · NPS glacial geology · NASA Earth facts. Photograph acknowledgements are collected on the Image credits page.