Teachers
A lesson for your classroom or geography club
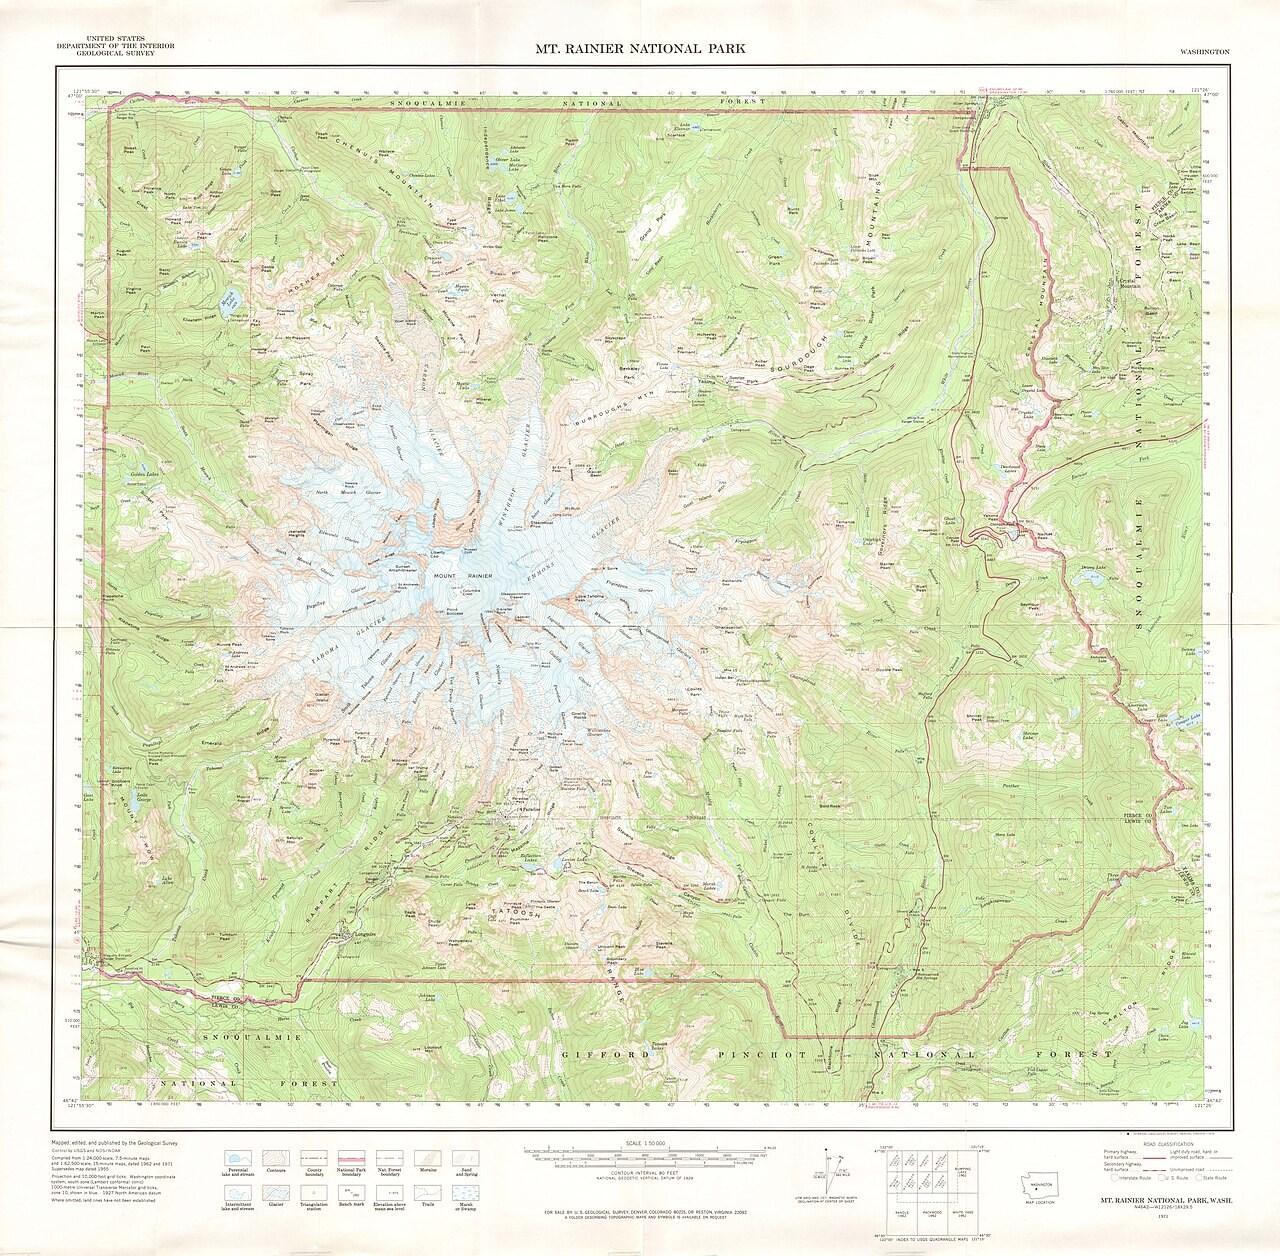
Contours ↔ 3D terrain
All teacher notes · Open the lab
A suggested lesson sequence
Use these stages at your own pace. Pause for students to sketch, compare observations or lead part of the demonstration.
01
Observe
Switch between the map and 3D hill. Follow a valley and a spur, then compare the direction in which their contours bend.
02
Tinker
Change Contour interval while keeping the terrain fixed. Compare tightly spaced and widely spaced contours and explain the difference in slope.
03
Explain
How can the same contour interval represent a gentle slope in one place and a steep slope in another?
04
Check
Choose an answer and explain your reasoning. Each question includes feedback.
Rehearse with the model
The same scene and controls as the lab. Load it when you are ready; use Start projector for the full classroom view.
Before the lesson
Relate contour spacing and shape to the height and slope of a landscape, then distinguish a valley from a spur.
Open the model before the lesson and choose a view that makes the important feature easy to see. Drag to rotate, and use the on-screen controls to change one variable at a time. The Controls panel explains the available keyboard shortcuts.
Ask students to predict the result before you change a setting. Compare the new view with the starting state.
Guide the demonstration
Switch between the map and 3D hill. Follow a valley and a spur, then compare the direction in which their contours bend.
Change Contour interval while keeping the terrain fixed. Compare tightly spaced and widely spaced contours and explain the difference in slope.
Discuss a common misconception
“The V-shaped bend of a contour always points downhill.” Where a contour crosses a stream valley, its bend generally points uphill and upstream. Around a projecting spur, the bend points downhill. Follow the height labels and nearby drainage to distinguish the two; the shape of a single line without context can be misleading.
Build the explanation
A contour joins places at the same elevation. Closely spaced contours indicate a steep slope, while wider spacing indicates a gentler slope; their patterns reveal valleys, ridges and summits.
Change Contour interval while keeping the terrain fixed. Compare tightly spaced and widely spaced contours and explain the difference in slope.
The same constructed terrain appears in both views, so changing the contour interval changes the map’s detail, not the hill.
Teaching notes
Count the height intervals between contour lines when calculating a change in elevation.
Use the contour values to identify uphill; north on the map does not necessarily point up the slope.
Ask students to match the same ridge or valley in both the map and the three-dimensional terrain.
Check understanding
Open Check for 4 questions. Ask students to explain their choice before revealing the answer.
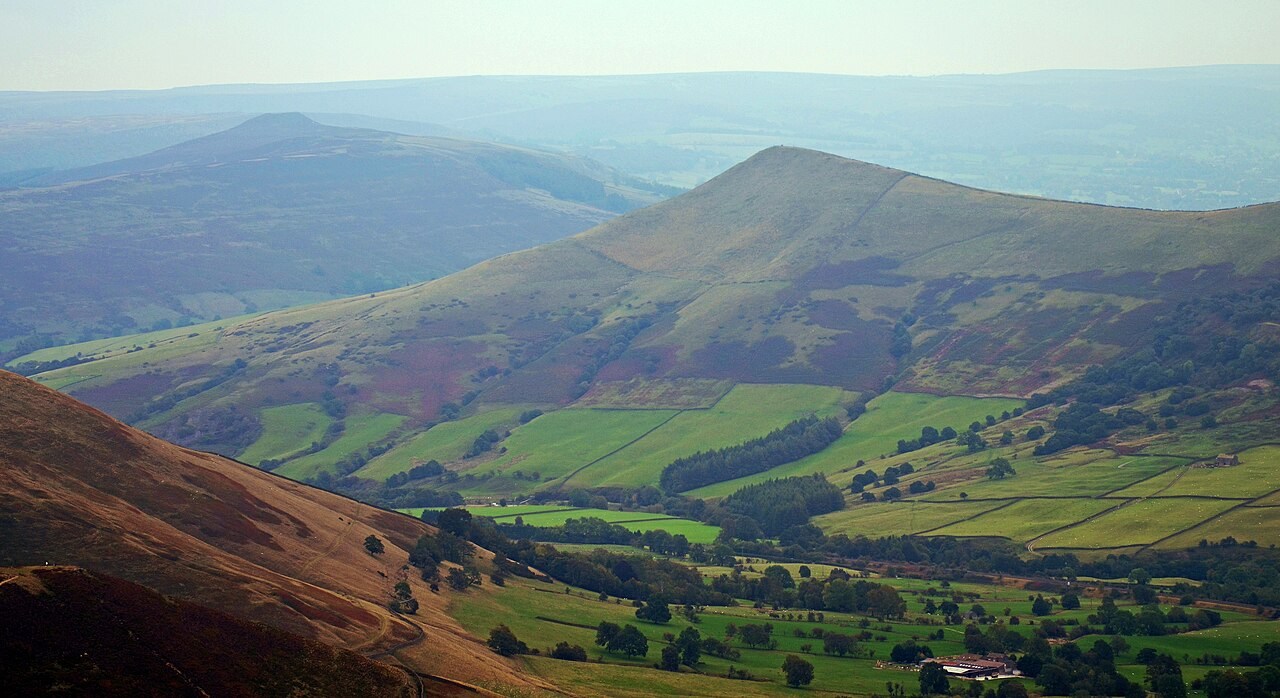
Return to the opening photograph. Ask students to identify one visible feature and explain which part of the model helps account for it.
Look more closely
Use these observations to connect the vocabulary to features students can identify.
Valley
Sources to keep beside the lesson
- OS map skills
- USGS topographic maps