Teachers
A lesson for your classroom or geography club
Map projections
All teacher notes · Open the lab
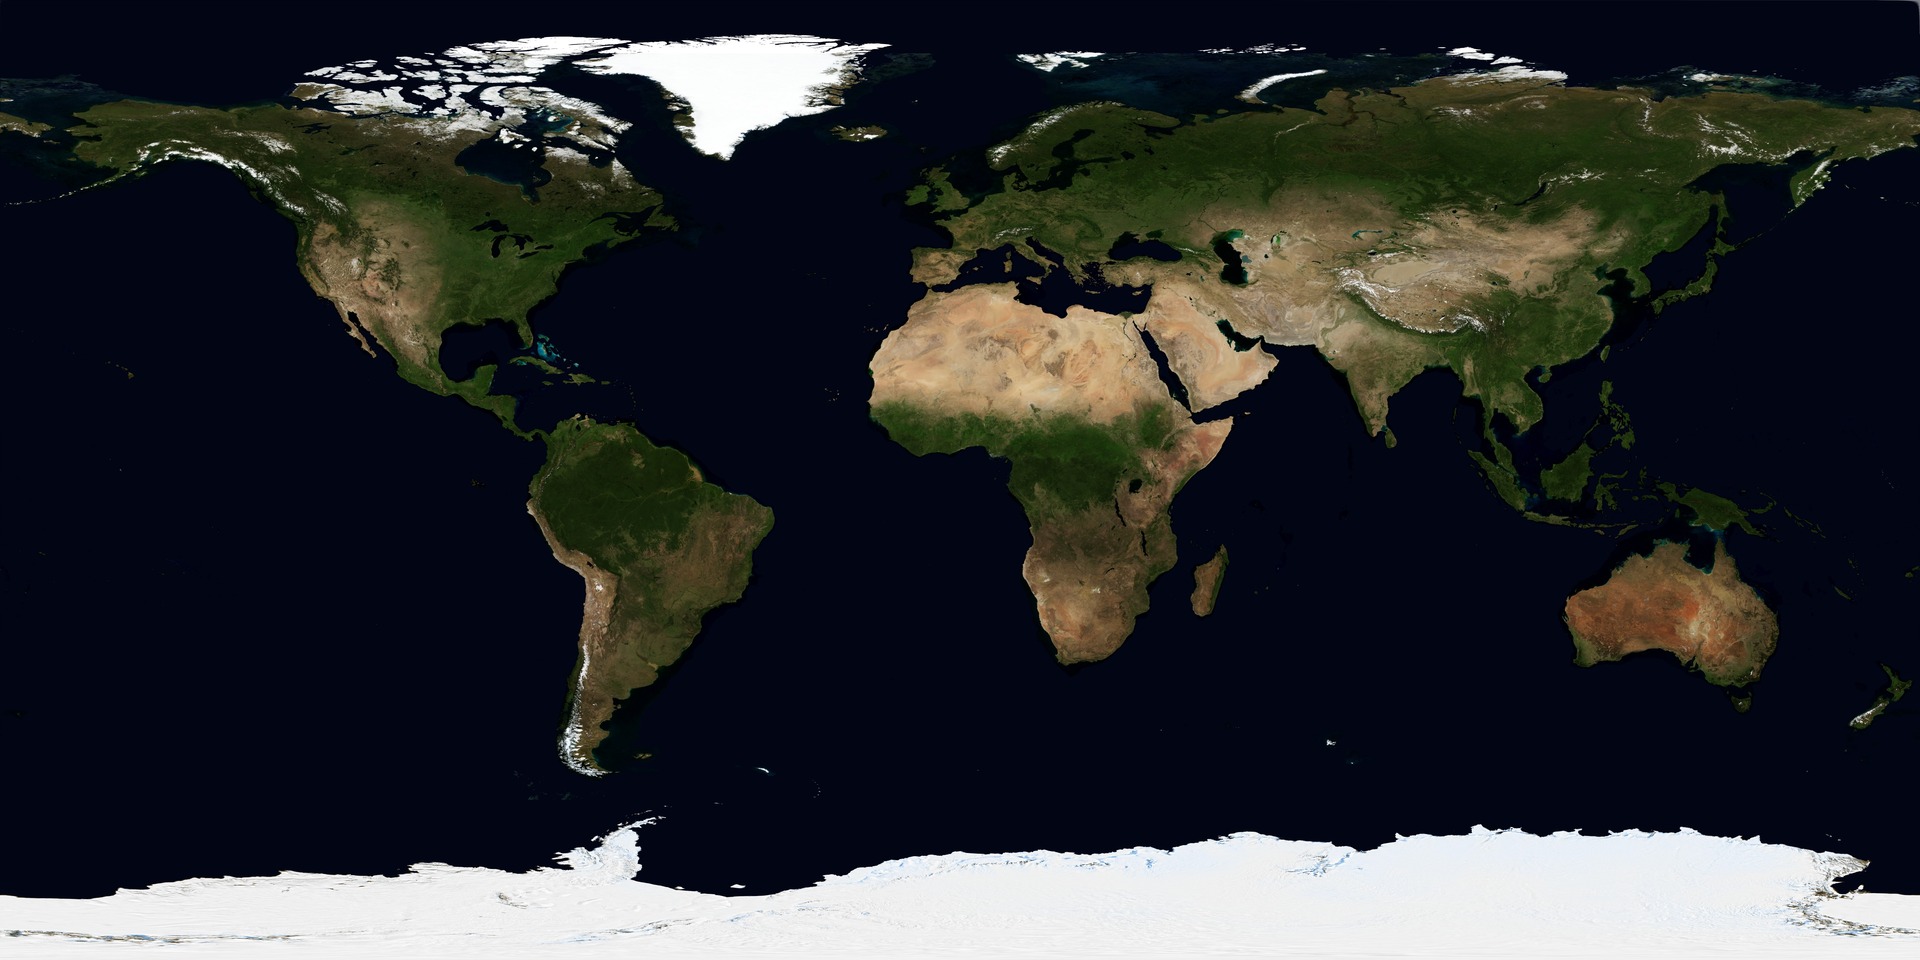
A suggested lesson sequence
Use these stages at your own pace. Pause for students to sketch, compare observations or lead part of the demonstration.
01
Observe
Compare Greenland and Africa on the globe before flattening it. Predict which properties may change on the map.
02
Tinker
Flatten each projection fully. Compare the equal-sized circles at low and high latitudes, then describe the trade-off between area and shape.
03
Explain
Choose a map use and explain which distortion would matter most for that purpose.
04
Check
Choose an answer and explain your reasoning. Each question includes feedback.
Rehearse with the model
The same scene and controls as the lab. Load it when you are ready; use Start projector for the full classroom view.
Before the lesson
Compare how map projections represent a curved Earth on a flat surface, identifying the distortions each introduces.
Open the model before the lesson and choose a view that makes the important feature easy to see. Drag to rotate, and use the on-screen controls to change one variable at a time. The Controls panel explains the available keyboard shortcuts.
Ask students to predict the result before you change a setting. Compare the new view with the starting state.
Guide the demonstration
Compare Greenland and Africa on the globe before flattening it. Predict which properties may change on the map.
Flatten each projection fully. Compare the equal-sized circles at low and high latitudes, then describe the trade-off between area and shape.
Discuss a common misconception
“One flat world map can preserve every area, shape, distance and direction.” Flattening Earth’s curved surface necessarily introduces distortion. A projection may preserve a selected property, such as area, while changing others. Compare a map with a globe and choose its projection according to the task, rather than assuming all visual comparisons are equally reliable.
Build the explanation
A map projection transfers positions from a curved surface to a plane. Every projection distorts some combination of area, shape, distance and direction, so the right choice depends on the map’s purpose.
Flatten each projection fully. Compare the equal-sized circles at low and high latitudes, then describe the trade-off between area and shape.
Judge each projection when it is fully flat; intermediate shapes are a visual transition rather than a separate projection.
Teaching notes
Compare the properties a projection preserves with those it distorts before choosing it for a task.
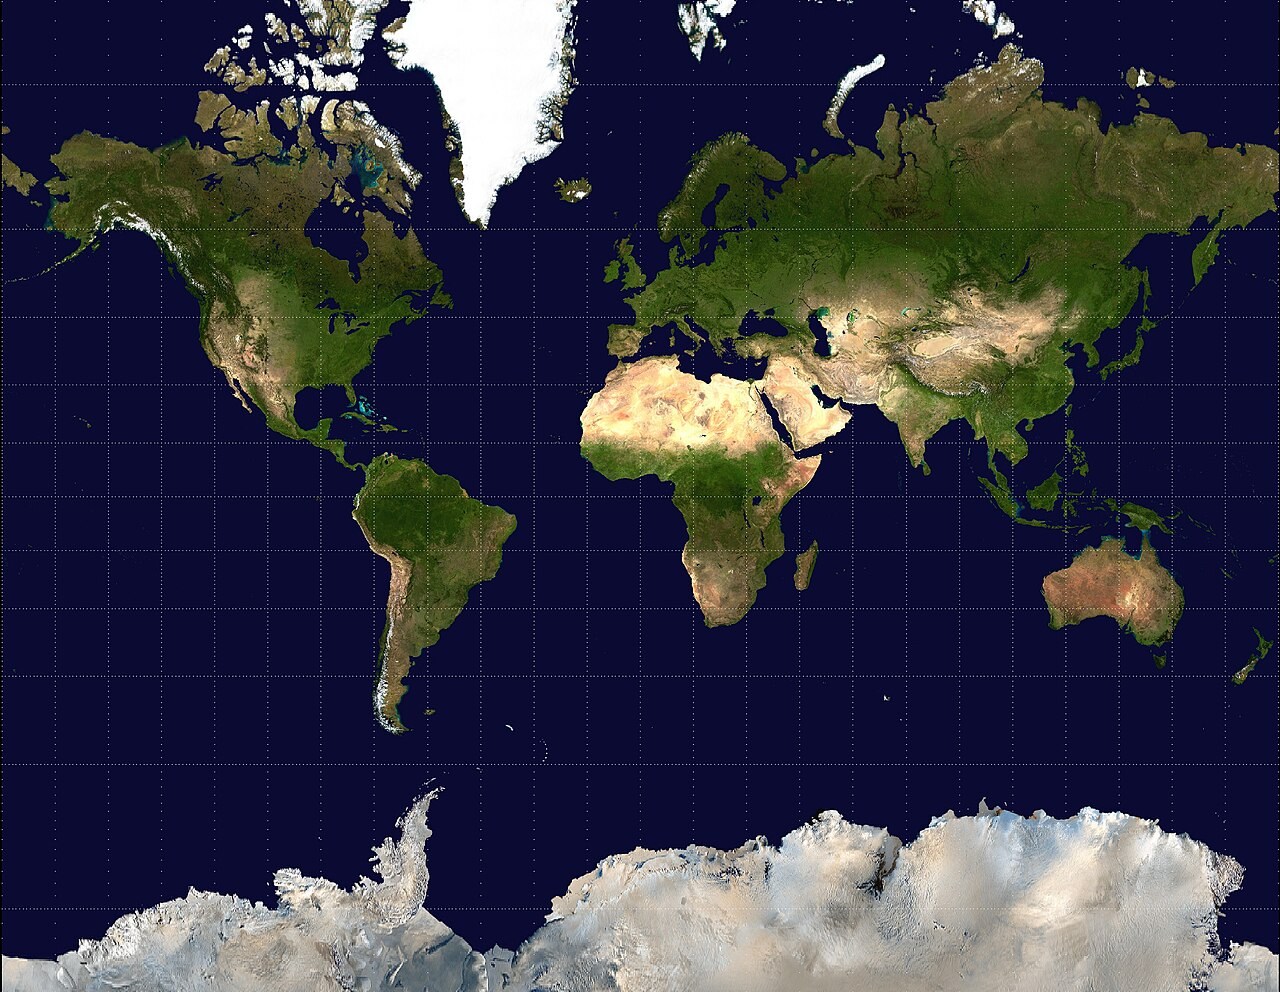
Use the globe to check area comparisons, including the enlarged appearance of Greenland on a Mercator map.
Distinguish the requirements of a world map from those of a local map covering a much smaller region.
Check understanding
Open Check for 4 questions. Ask students to explain their choice before revealing the answer.
Return to the opening photograph. Ask students to identify one visible feature and explain which part of the model helps account for it.
Look more closely
Use these observations to connect the vocabulary to features students can identify.
Mercator
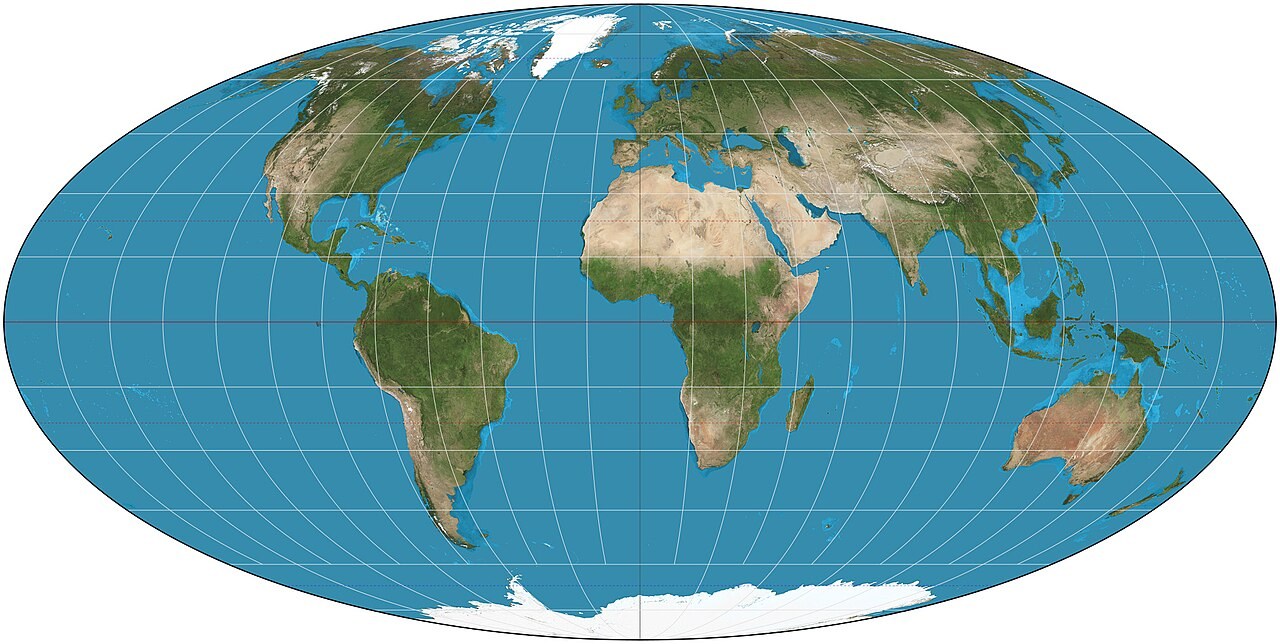
Equal-area
Sources to keep beside the lesson
- USGS map projections
- Natural Earth