Teachers
A lesson for your classroom or geography club
Earth’s energy budget
All teacher notes · Open the lab
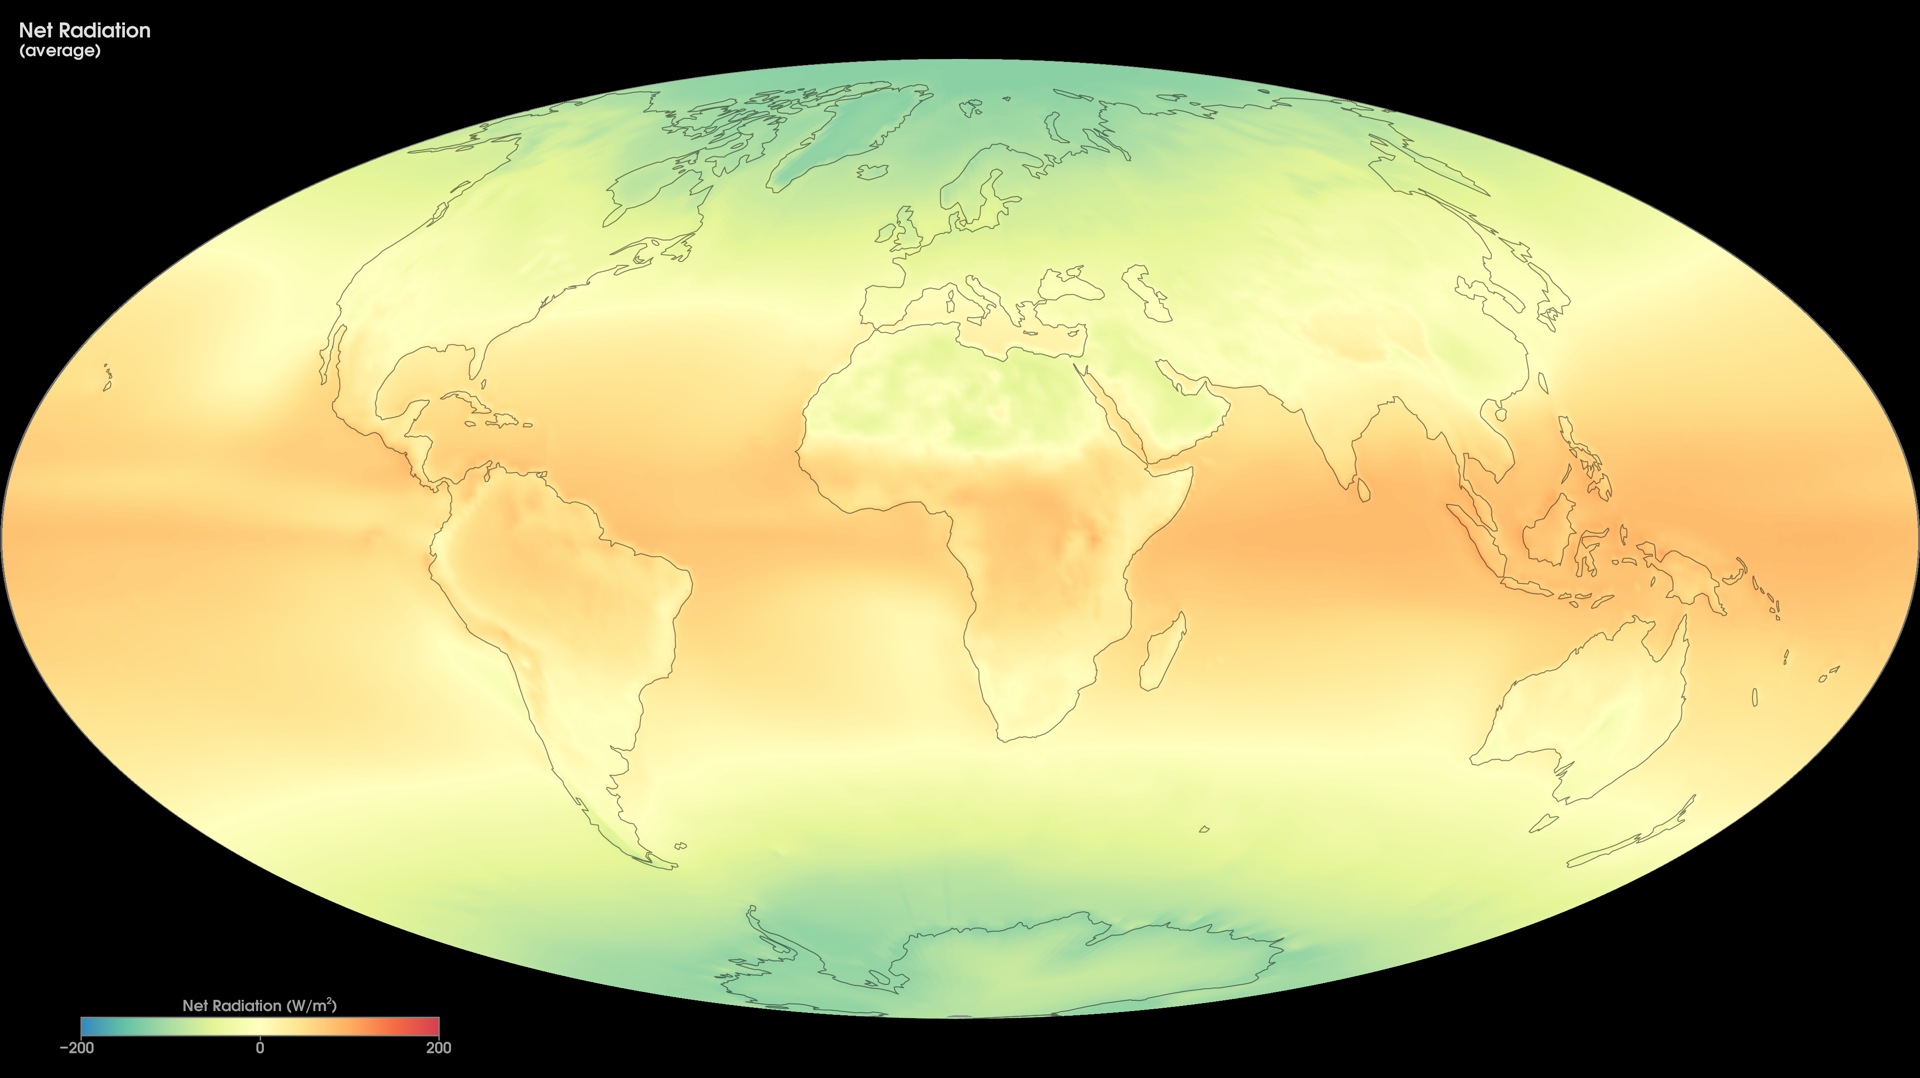
A suggested lesson sequence
Use these stages at your own pace. Pause for students to sketch, compare observations or lead part of the demonstration.
01
Observe
Explain why solar irradiance is divided by four. Use albedo 0.3 and turn Greenhouse off. Read the surface temperature.
02
Tinker
Turn Greenhouse on; distinguish surface emission from outgoing radiation at the top of the atmosphere. Check the top-of-atmosphere balance.
03
Explain
Explain why a change in reflected sunlight or infrared absorption changes the temperature needed for energy balance.
04
Check
Choose an answer and explain your reasoning. Each question includes feedback.
Rehearse with the model
The same scene and controls as the lab. Load it when you are ready; use Start projector for the full classroom view.
Before the lesson
Trace energy entering and leaving Earth, and explain how reflection and atmospheric absorption affect the surface temperature.
Open the model before the lesson and choose a view that makes the important feature easy to see. Drag to rotate, and use the on-screen controls to change one variable at a time. The Controls panel explains the available keyboard shortcuts.
Pause the animation at a useful moment. Ask students what should happen next, then play it to test their explanation.
Guide the demonstration
Explain why solar irradiance is divided by four. Use albedo 0.3 and turn Greenhouse off. Read the surface temperature.
Turn Greenhouse on; distinguish surface emission from outgoing radiation at the top of the atmosphere. Check the top-of-atmosphere balance.
Discuss a common misconception
“Greenhouse gases mainly warm Earth by trapping incoming visible sunlight.” Much incoming solar radiation reaches the surface, where some is absorbed. The warmed surface emits thermal infrared radiation, which greenhouse gases and clouds absorb and emit. This exchange changes the surface temperature needed for the Earth system to balance absorbed solar energy with energy leaving for space.
Build the explanation
Earth reflects some incoming sunlight and absorbs the rest. Its temperature adjusts as outgoing thermal radiation balances absorbed energy; greenhouse gases change the exchange of thermal radiation.
Turn Greenhouse on; distinguish surface emission from outgoing radiation at the top of the atmosphere. Check the top-of-atmosphere balance.
This simple energy-balance model isolates selected processes rather than representing the full atmosphere and climate system.
Teaching notes
Distinguish the model’s energy transfers from a prediction of future climate.
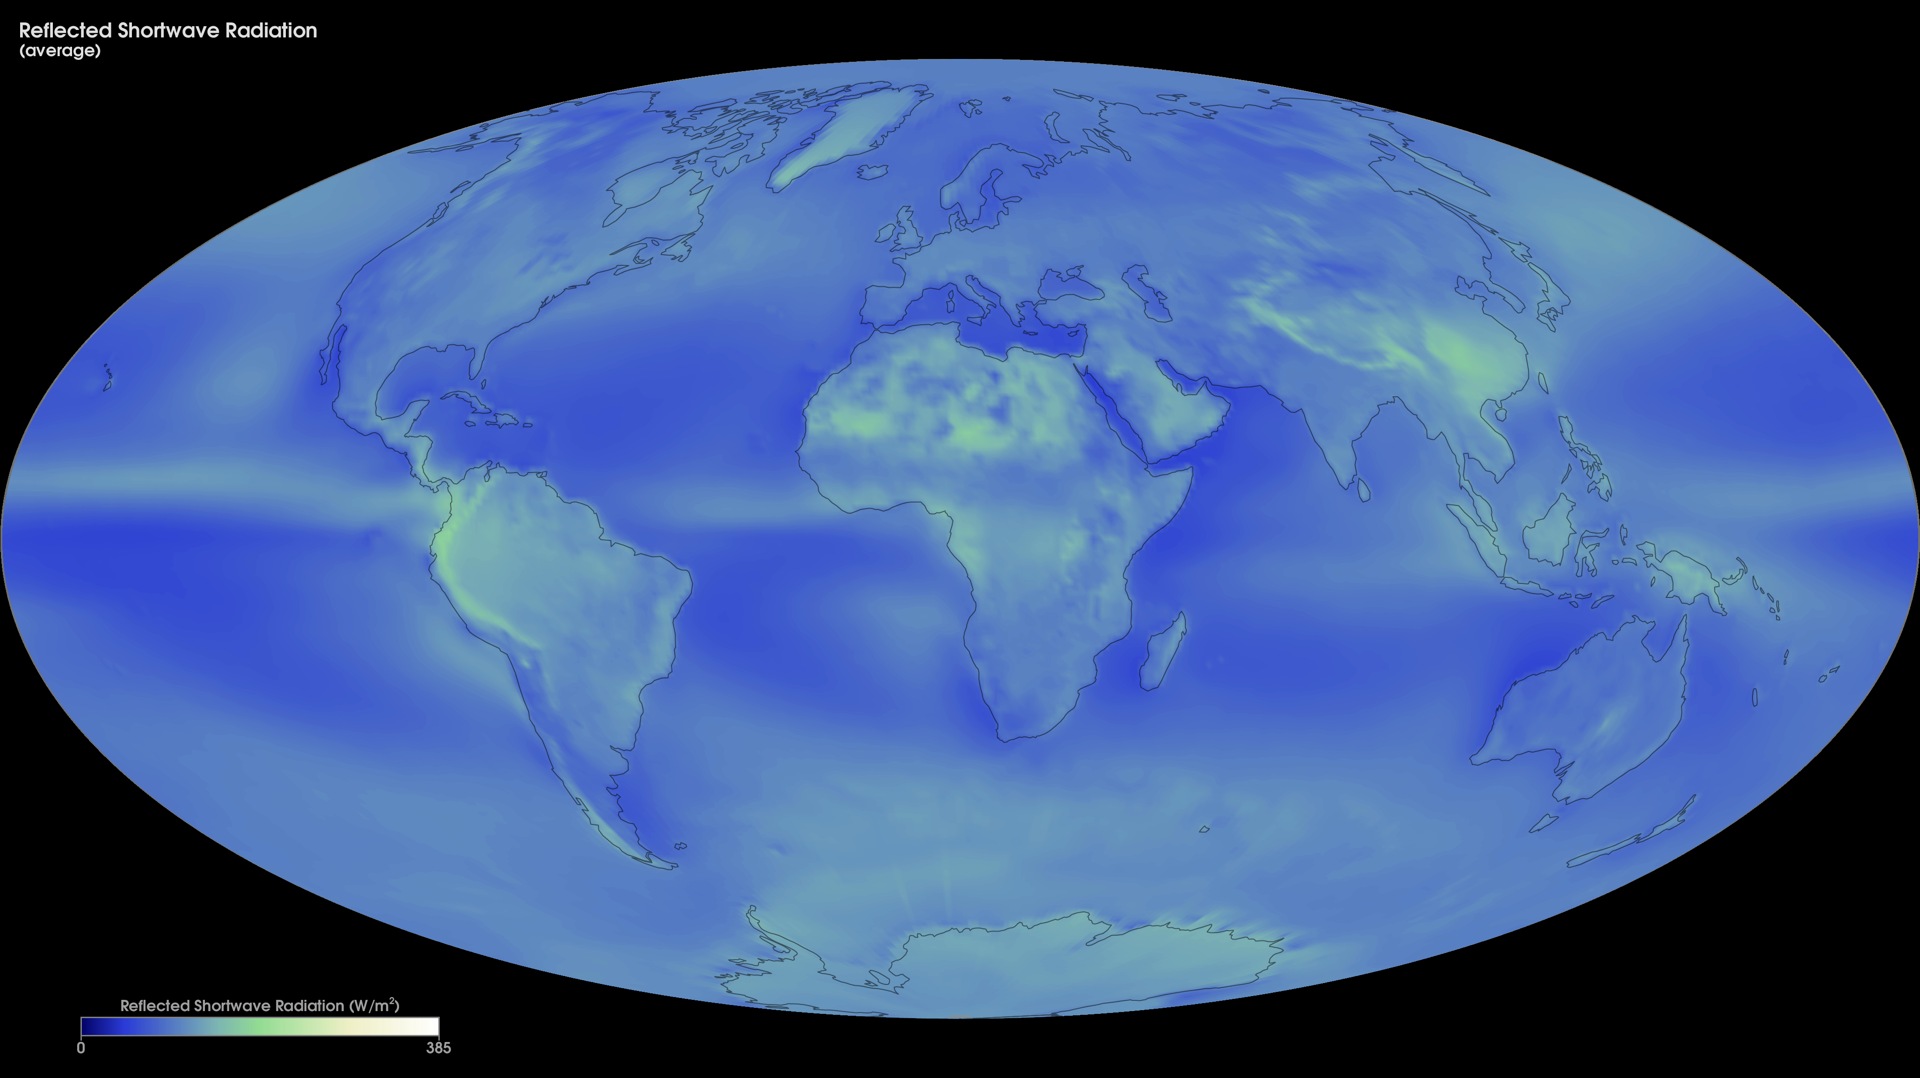
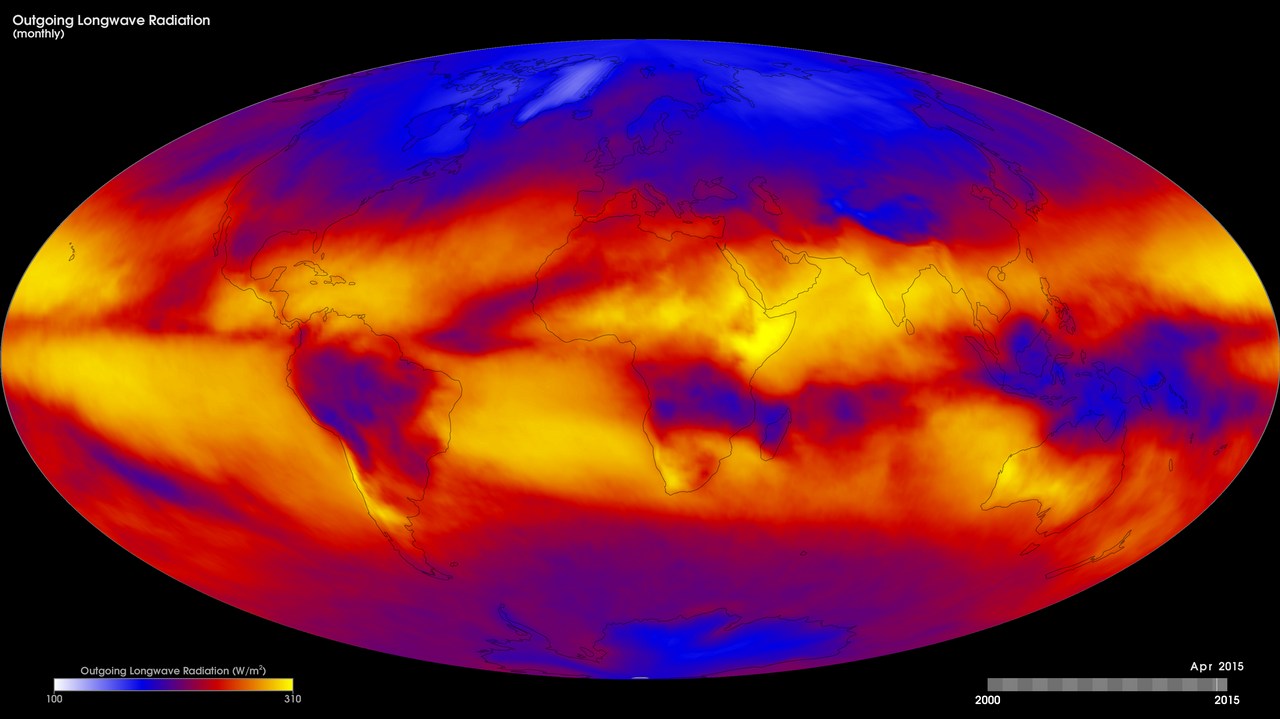
Explain albedo as the fraction of incoming sunlight reflected, and distinguish shortwave sunlight from outgoing longwave radiation.
Use only the energy values supplied by the model when comparing transfers or checking a budget.
Check understanding
Open Check for 4 questions. Ask students to explain their choice before revealing the answer.
Return to the opening photograph. Ask students to identify one visible feature and explain which part of the model helps account for it.
Look more closely
Use these observations to connect the vocabulary to features students can identify.
Albedo
Longwave
Sources to keep beside the lesson
- NASA energy budget diagram
- NOAA climate
- University of Washington one-layer radiation balance
Watch an explanation
The film stays paused until you play it.
What Does the Atmosphere Do? Crash Course Geography #6 Crash Course