Teachers
A lesson for your classroom or geography club
ENSO and the Walker cell
All teacher notes · Open the lab
A suggested lesson sequence
Use these stages at your own pace. Pause for students to sketch, compare observations or lead part of the demonstration.
01
Observe
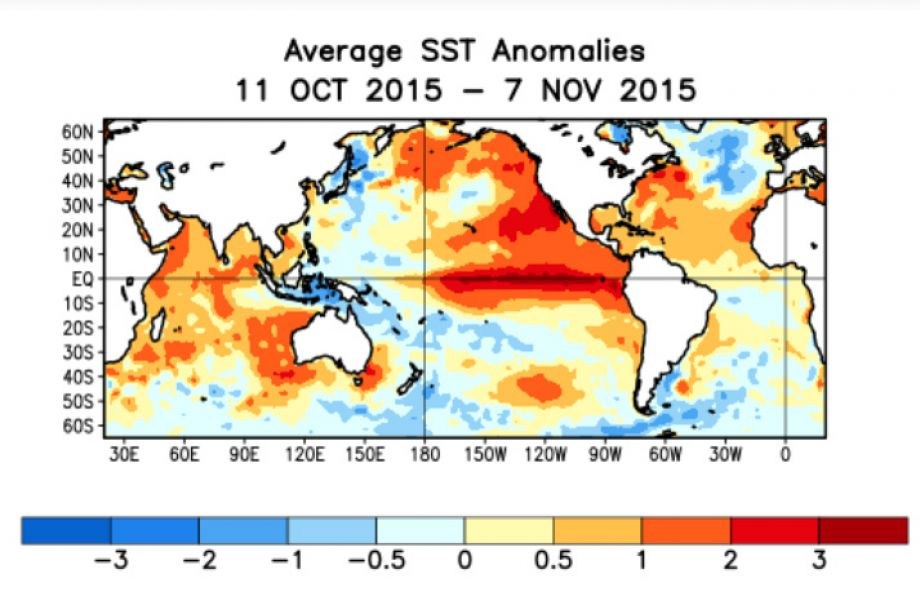
Start at ENSO 0 and identify west, east and the thermocline. Trace rising air in the west and surface trades towards it.
02
Tinker
Move to El Niño and compare eastern temperature and thermocline depth. Compare La Niña and explain the stronger contrast.
03
Explain
How does a change in the trade winds affect Pacific surface temperatures and the location of rising air?
04
Check
Choose an answer and explain your reasoning. Each question includes feedback.
Rehearse with the model
The same scene and controls as the lab. Load it when you are ready; use Start projector for the full classroom view.
Before the lesson
Compare normal Pacific conditions with El Niño and La Niña, and explain how changes in winds and ocean temperature affect rainfall.
Open the model before the lesson and choose a view that makes the important feature easy to see. Drag to rotate, and use the on-screen controls to change one variable at a time. The Controls panel explains the available keyboard shortcuts.
Pause the animation at a useful moment. Ask students what should happen next, then play it to test their explanation.
Guide the demonstration
Start at ENSO 0 and identify west, east and the thermocline. Trace rising air in the west and surface trades towards it.
Move to El Niño and compare eastern temperature and thermocline depth. Compare La Niña and explain the stronger contrast.
Discuss a common misconception
“El Niño causes the same weather in every affected place during every event.” ENSO changes tropical Pacific ocean and atmospheric conditions, influencing weather probabilities in many regions. The response depends on season, event strength and other climate conditions. A regional tendency towards wetter or drier weather is not a guarantee for every location, day or event.
Build the explanation
Across the tropical Pacific, trade winds, warm surface water and the thermocline interact. El Niño and La Niña describe departures from the usual coupled ocean–atmosphere pattern.
Move to El Niño and compare eastern temperature and thermocline depth. Compare La Niña and explain the stronger contrast.
The selected states illustrate these relationships; their effects on weather vary between events and places.
Teaching notes
Locate the changing trade winds, warm water and rising air in the tropical Pacific before discussing effects elsewhere.
Describe ENSO as a pattern that changes the likelihood of regional conditions rather than a forecast for a specific day.
Ask students to explain the ocean–atmosphere interaction before connecting the model with a distant weather event.
Check understanding
Open Check for 4 questions. Ask students to explain their choice before revealing the answer.
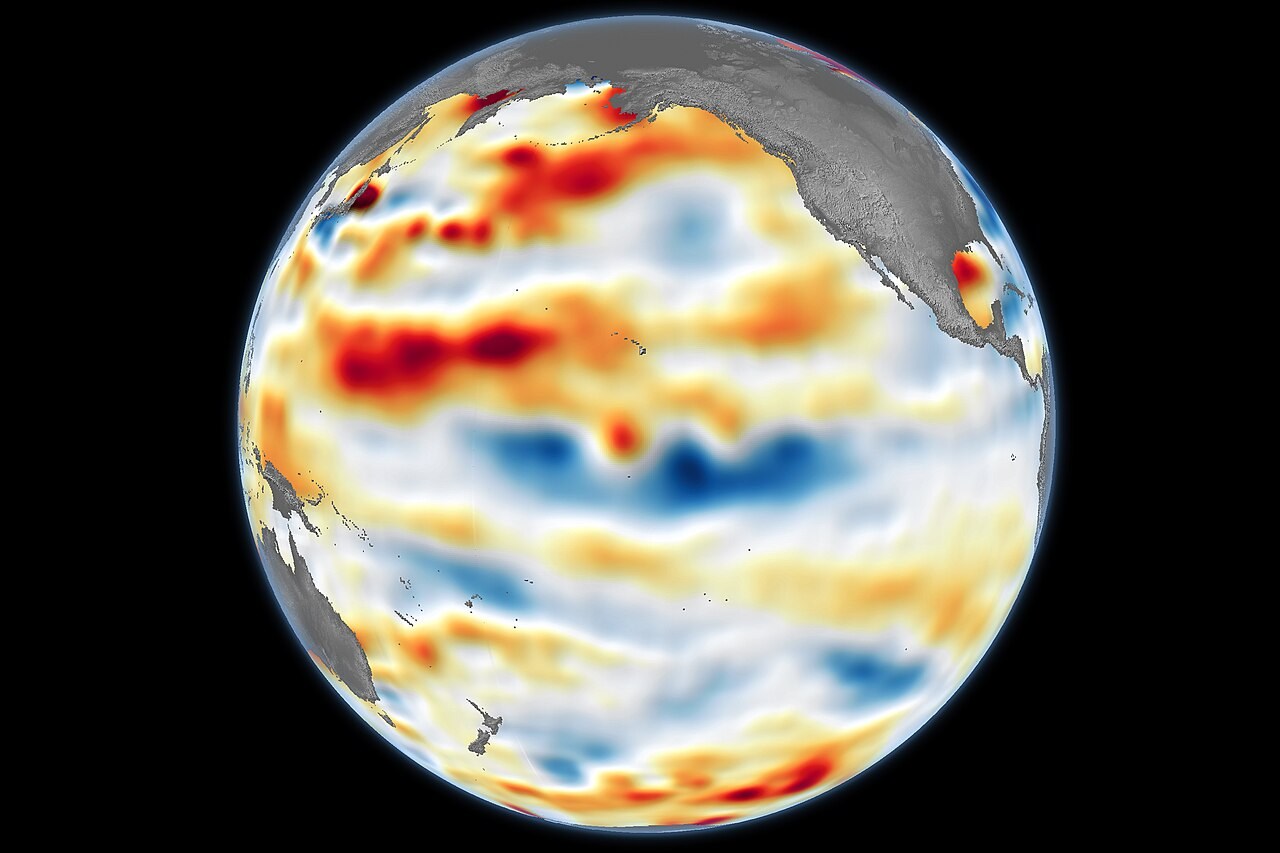
Return to the opening photograph. Ask students to identify one visible feature and explain which part of the model helps account for it.
Look more closely
Use these observations to connect the vocabulary to features students can identify.
Walker cell
Warm pool
Sources to keep beside the lesson
- NOAA ENSO
- Met Office ENSO
- NOAA ENSO wind and thermocline changes