Teachers
A lesson for your classroom or geography club
Storm hydrograph
All teacher notes · Open the lab
A suggested lesson sequence
Use these stages at your own pace. Pause for students to sketch, compare observations or lead part of the demonstration.
01
Observe
Play the storm and compare rainfall with the rising and falling limbs of river discharge. Locate the rainfall and discharge peaks.
02
Tinker
Increase Urban cover and compare peak discharge and lag time. Return to a less urban catchment and explain how infiltration and storage change the response.
03
Explain
Why does the discharge peak occur after the rainfall peak, and how can urban cover change that delay?
04
Check
Choose an answer and explain your reasoning. Each question includes feedback.
Rehearse with the model
The same scene and controls as the lab. Load it when you are ready; use Start projector for the full classroom view.
Before the lesson
Read the main features of a storm hydrograph and explain how urban surfaces can change the timing and size of peak discharge.
Open the model before the lesson and choose a view that makes the important feature easy to see. Drag to rotate, and use the on-screen controls to change one variable at a time. The Controls panel explains the available keyboard shortcuts.
Pause the animation at a useful moment. Ask students what should happen next, then play it to test their explanation.
Guide the demonstration
Play the storm and compare rainfall with the rising and falling limbs of river discharge. Locate the rainfall and discharge peaks.
Increase Urban cover and compare peak discharge and lag time. Return to a less urban catchment and explain how infiltration and storage change the response.
Discuss a common misconception
“Peak river discharge occurs at exactly the same time as peak rainfall.” Water takes time to move through a catchment and its stores, so the discharge peak commonly follows the rainfall peak. The delay depends on rainfall location and duration, catchment size, slopes, soil conditions and drainage. State which rainfall reference is used when measuring lag time.
Build the explanation
A storm hydrograph shows how river discharge changes after rainfall. Infiltration, storage and routing delay the response; a greater runoff fraction can produce a higher and earlier peak.
Increase Urban cover and compare peak discharge and lag time. Return to a less urban catchment and explain how infiltration and storage change the response.
The calculation uses an invented catchment and prescribed storm so you can compare processes without treating the curve as a local forecast.
Teaching notes
Distinguish river stage, which is a water level, from discharge, which is a volume passing per unit time.
Compare the rainfall peak with the discharge peak and explain the processes that produce a time lag.
Use the timescale of the response to distinguish a rapid flood from a flood with a prolonged recession.
Check understanding
Open Check for 4 questions. Ask students to explain their choice before revealing the answer.
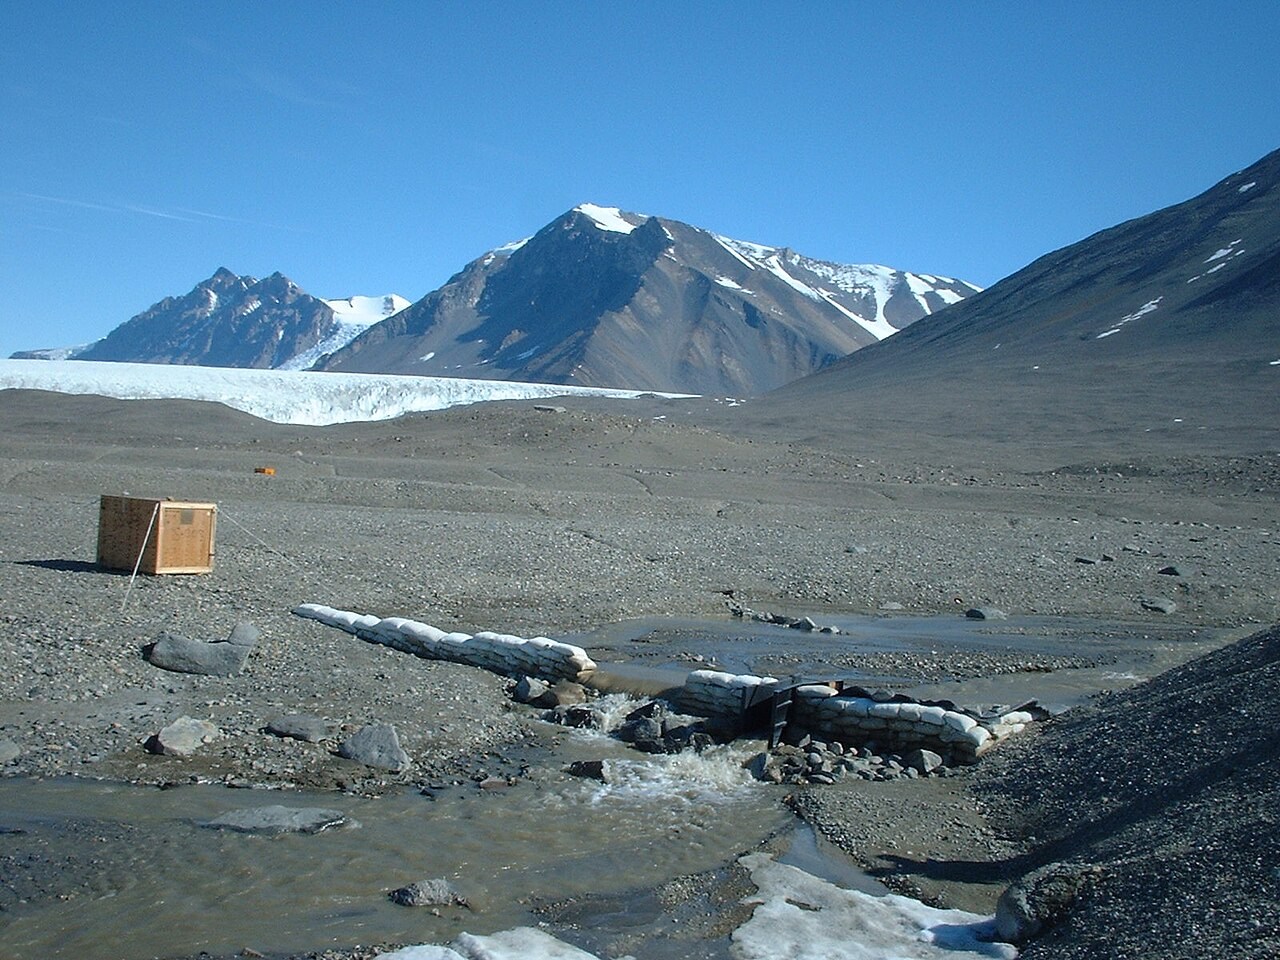
Return to the opening photograph. Ask students to identify one visible feature and explain which part of the model helps account for it.
Look more closely
Use these observations to connect the vocabulary to features students can identify.
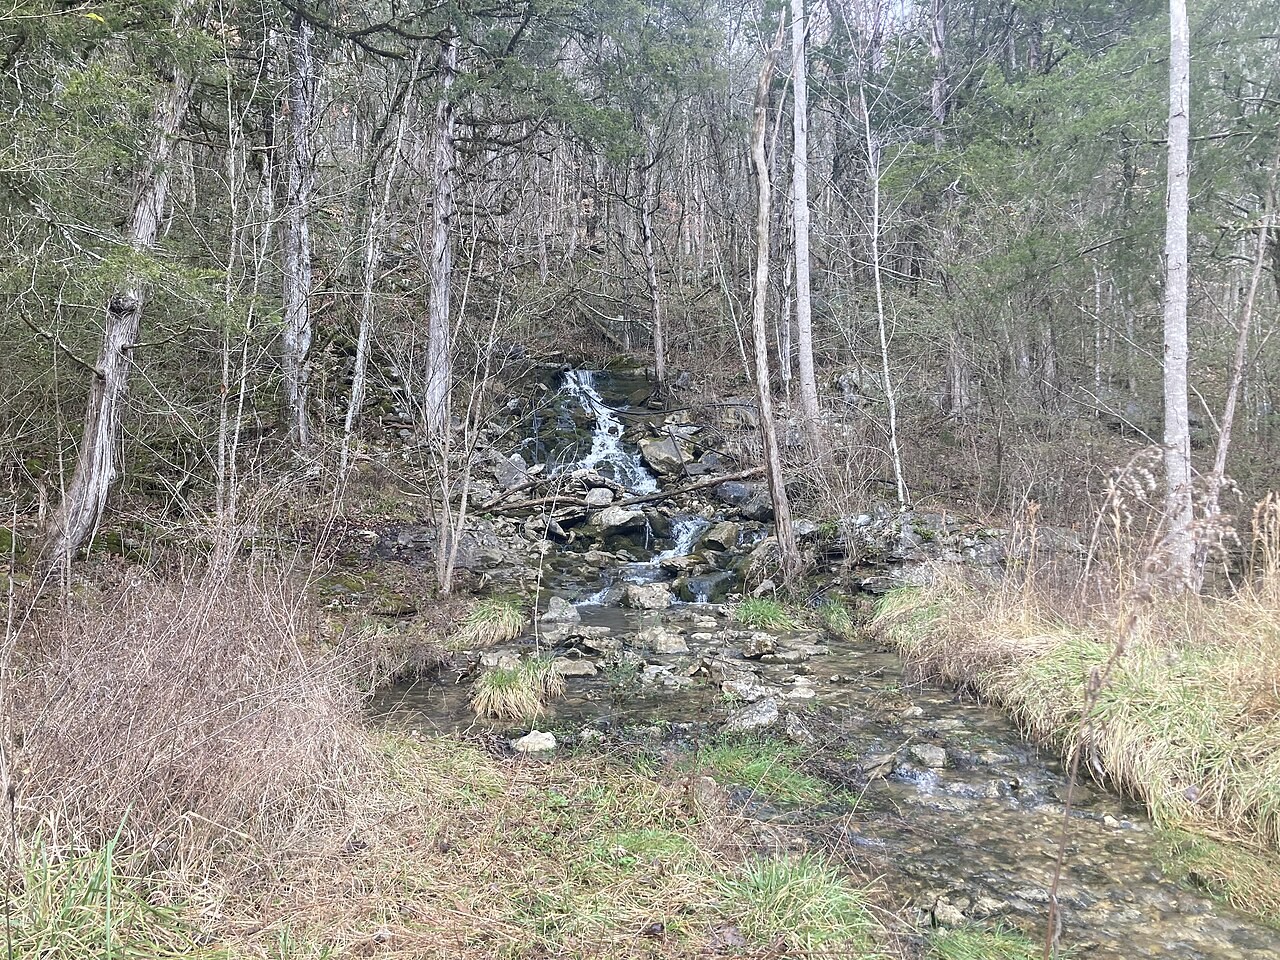
Baseflow
Sources to keep beside the lesson
- UKCEH
- USGS NWIS
- USACE linear-reservoir methods