Teachers
A lesson for your classroom or geography club
Fronts as wedges
All teacher notes · Open the lab
A suggested lesson sequence
Use these stages at your own pace. Pause for students to sketch, compare observations or lead part of the demonstration.
01
Observe
Identify cold air, the warm sector and cool air ahead. Compare the two prescribed slopes.
02
Tinker
Scrub Process to 0.70, where the surface warm sector closes. Continue and locate warm air above the meeting point.
03
Explain
Explain how the slopes and motion of contrasting air masses affect where warm air rises.
04
Check
Choose an answer and explain your reasoning. Each question includes feedback.
Rehearse with the model
The same scene and controls as the lab. Load it when you are ready; use Start projector for the full classroom view.
Before the lesson
Compare warm, cold and occluded fronts, and explain how the movement of contrasting air masses produces cloud and rain.
Open the model before the lesson and choose a view that makes the important feature easy to see. Drag to rotate, and use the on-screen controls to change one variable at a time. The Controls panel explains the available keyboard shortcuts.
Pause the animation at a useful moment. Ask students what should happen next, then play it to test their explanation.
Guide the demonstration
Identify cold air, the warm sector and cool air ahead. Compare the two prescribed slopes.
Scrub Process to 0.70, where the surface warm sector closes. Continue and locate warm air above the meeting point.
Discuss a common misconception
“A front is a solid wall that keeps two air masses completely separate.” A front is a transition zone across which properties such as temperature and humidity change. Its slope and movement affect how air is lifted, with cloud and precipitation depending on moisture and stability. Mixing occurs, and real fronts have more complex shapes than a single dividing line.
Build the explanation
A weather front separates air masses with different temperature and density. A colder air mass can undercut warmer air, while a warm front rises more gradually over cold air ahead.
Scrub Process to 0.70, where the surface warm sector closes. Continue and locate warm air above the meeting point.
The chosen front slopes and speeds illustrate their geometry; cloud shapes do not calculate rainfall totals.
Teaching notes
Use the three-dimensional slope of a front to explain cloud and rainfall patterns beyond its line on a map.
Compare the slopes of warm and cold fronts without drawing either as a perfectly vertical wall.
Distinguish rainbands associated with midlatitude fronts from the structure of a tropical cyclone.
Check understanding
Open Check for 4 questions. Ask students to explain their choice before revealing the answer.
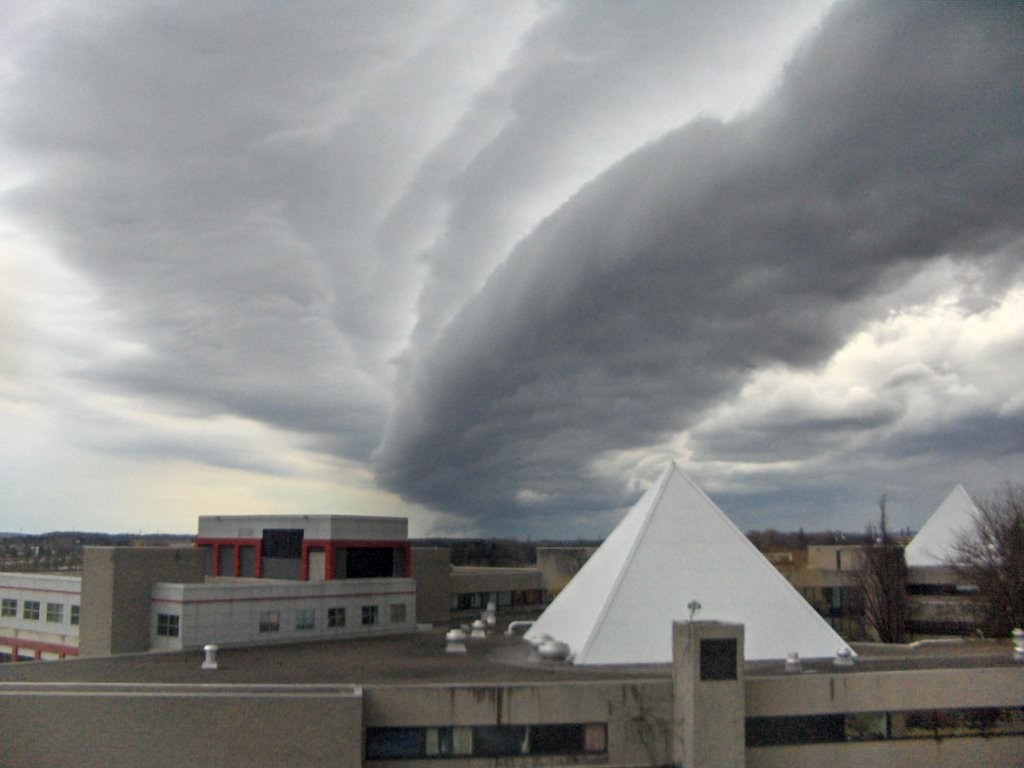
Return to the opening photograph. Ask students to identify one visible feature and explain which part of the model helps account for it.
Look more closely
Use these observations to connect the vocabulary to features students can identify.
Warm front
Sources to keep beside the lesson
- Met Office fronts
- NOAA weather systems
- Met Office weather fronts