Teachers
A lesson for your classroom or geography club
Ocean currents
All teacher notes · Open the lab
A suggested lesson sequence
Use these stages at your own pace. Pause for students to sketch, compare observations or lead part of the demonstration.
01
Observe
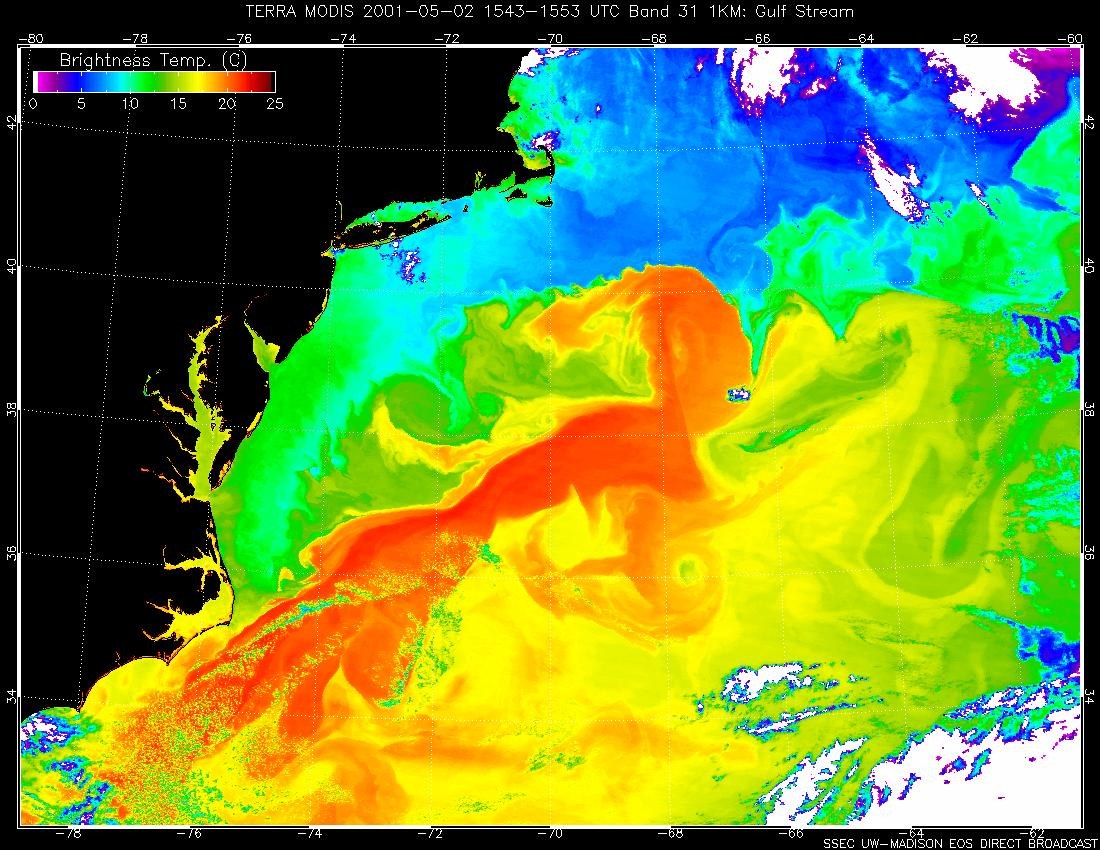
Select North Atlantic and identify its western and eastern boundaries. Follow the arrows and name Gulf Stream and Canary Current.
02
Tinker
Compare South Atlantic and explain the reversed sense of rotation. Locate all five subtropical gyres.
03
Explain
How do winds, Earth’s rotation and ocean-basin boundaries help organise the major surface gyres?
04
Check
Choose an answer and explain your reasoning. Each question includes feedback.
Rehearse with the model
The same scene and controls as the lab. Load it when you are ready; use Start projector for the full classroom view.
Before the lesson
Follow the major surface currents and explain how winds and ocean heat transport contribute to regional climate.
Open the model before the lesson and choose a view that makes the important feature easy to see. Drag to rotate, and use the on-screen controls to change one variable at a time. The Controls panel explains the available keyboard shortcuts.
Pause the animation at a useful moment. Ask students what should happen next, then play it to test their explanation.
Guide the demonstration
Select North Atlantic and identify its western and eastern boundaries. Follow the arrows and name Gulf Stream and Canary Current.
Compare South Atlantic and explain the reversed sense of rotation. Locate all five subtropical gyres.
Discuss a common misconception
“Ocean currents are driven only by differences in water temperature.” Winds and pressure gradients drive much upper-ocean circulation, with Earth’s rotation and coastlines shaping the flow. Temperature and salinity affect density and contribute to overturning, while mixing connects different depths. Surface gyres and deep circulation are related but cannot be explained by temperature alone.
Build the explanation
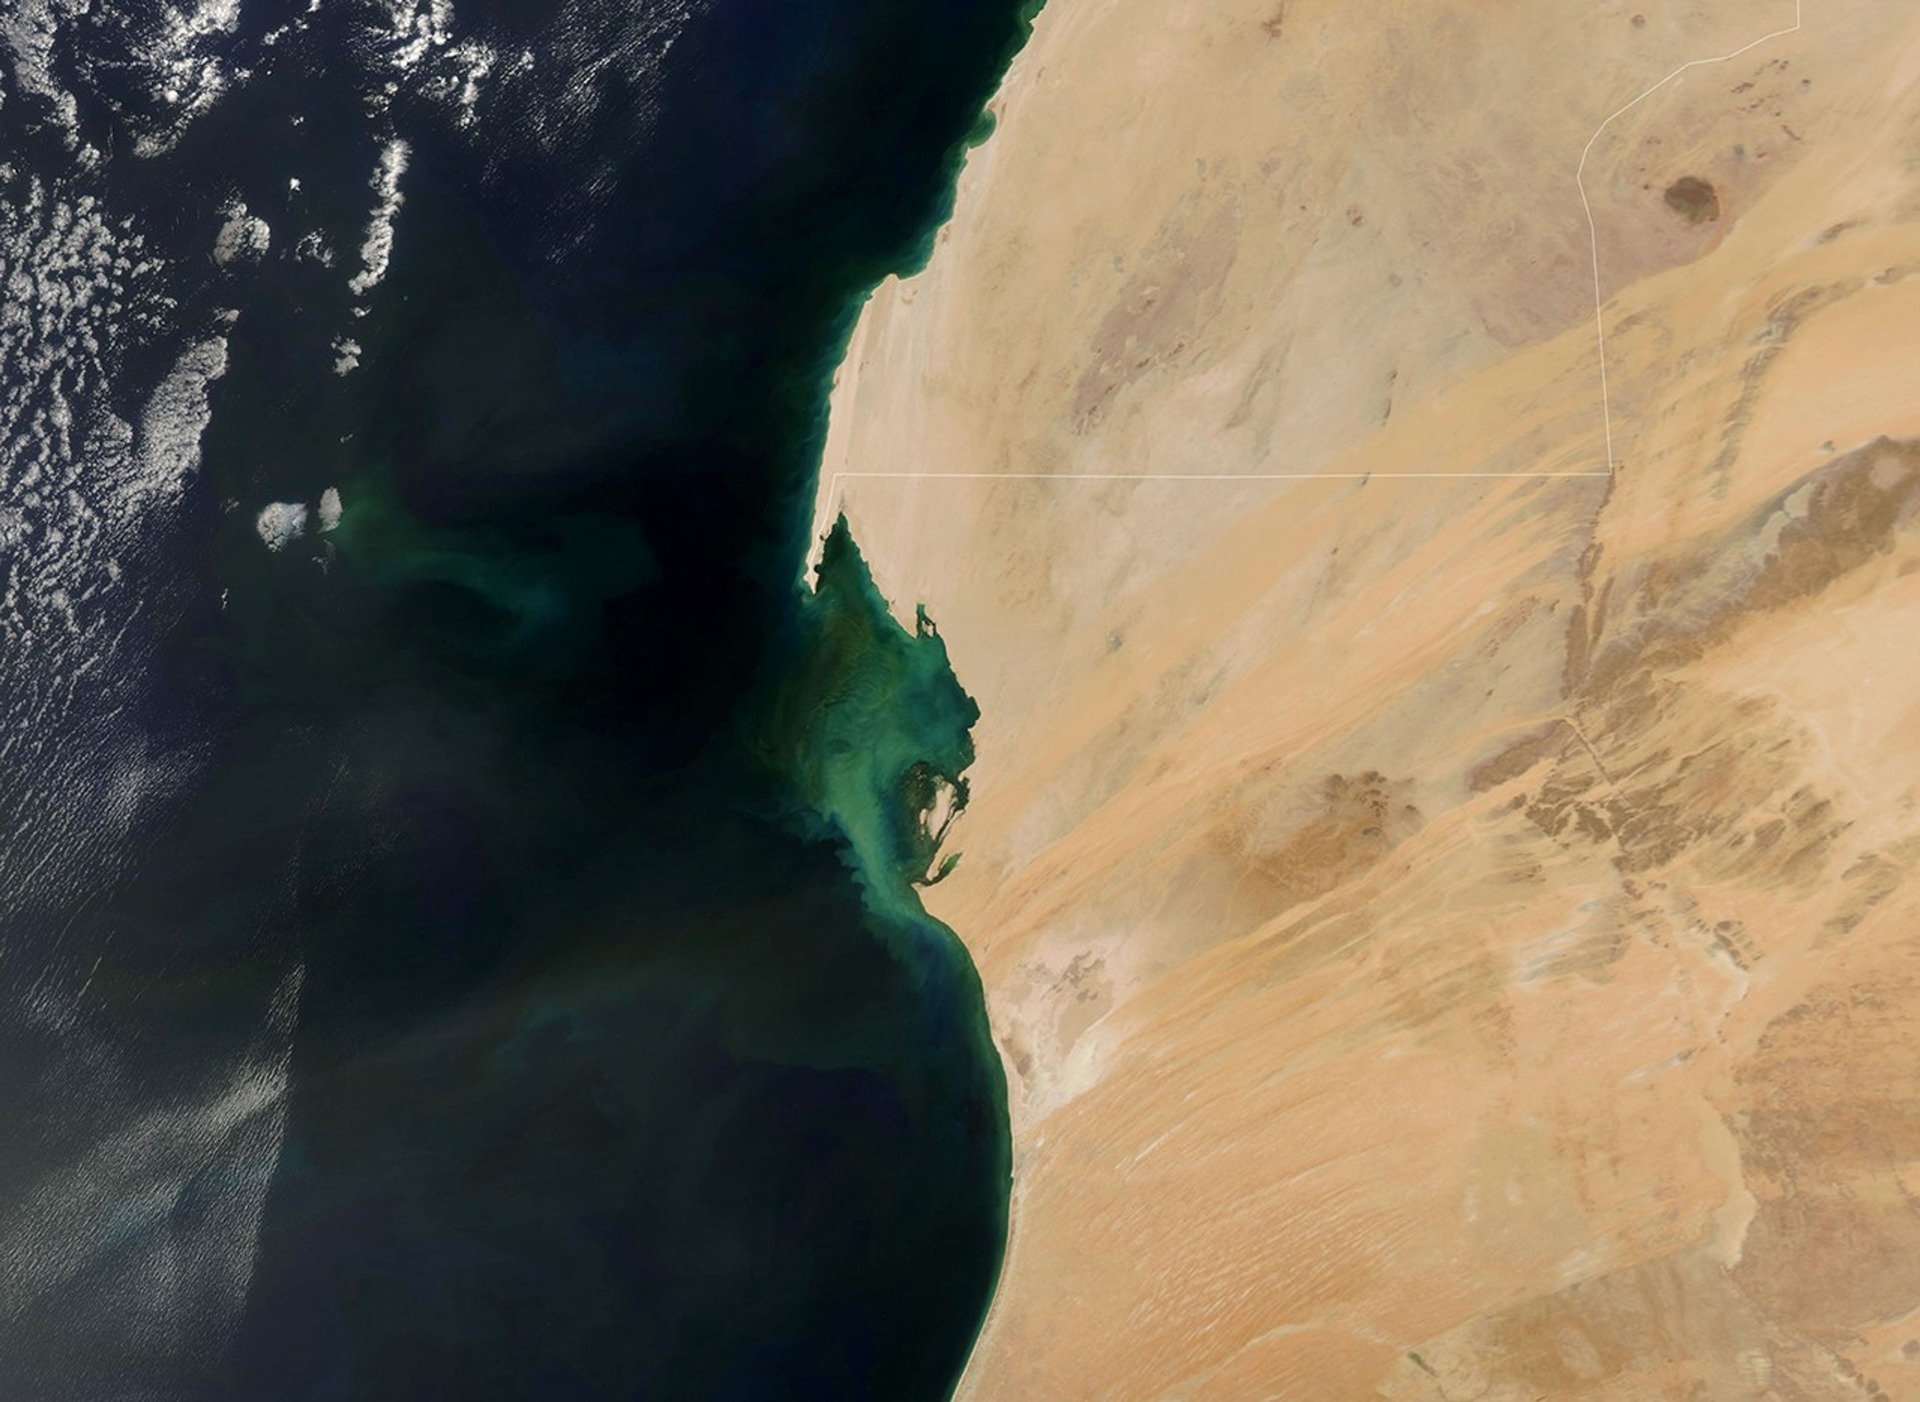
Surface winds and Earth’s rotation help organise subtropical ocean gyres. Warm western boundary currents generally carry water poleward, while cooler eastern boundary currents carry it towards the equator.
Compare South Atlantic and explain the reversed sense of rotation. Locate all five subtropical gyres.
The globe shows the broad routes and directions of currents; their width and tracer speed are enlarged for reading.
Teaching notes
Distinguish wind-driven surface gyres from the deeper overturning circulation.
Explain that the Gulf Stream transports heat as part of a wider ocean–atmosphere system.
Consider atmospheric circulation and maritime exposure as well as ocean currents when discussing the United Kingdom’s climate.
Check understanding
Open Check for 4 questions. Ask students to explain their choice before revealing the answer.
Return to the opening photograph. Ask students to identify one visible feature and explain which part of the model helps account for it.
Look more closely
Use these observations to connect the vocabulary to features students can identify.
Eastern boundary current
Subtropical high
Sources to keep beside the lesson
- NOAA ocean
- Met Office
- NOAA subtropical gyres
Watch an explanation
The film stays paused until you play it.
How Do Oceans Circulate? Crash Course Geography #9 Crash Course