Teachers
A lesson for your classroom or geography club
Isostasy
All teacher notes · Open the lab
A suggested lesson sequence
Use these stages at your own pace. Pause for students to sketch, compare observations or lead part of the demonstration.
01
Observe
Identify crust, root and solid mantle. Set the ice load to zero, then 3000 m. Predict the direction of motion.
02
Tinker
Calculate 3000 × 917/3300 and compare the displayed depression. Switch to physical scale to see the vertical and horizontal dimensions at the same scale.
03
Explain
Explain why adding an ice load depresses the crust and why removing it allows rebound.
04
Check
Choose an answer and explain your reasoning. Each question includes feedback.
Rehearse with the model
The same scene and controls as the lab. Load it when you are ready; use Start projector for the full classroom view.
Before the lesson
Explain how the crust responds to loading and unloading, using an ice sheet to explore subsidence and rebound.
Open the model before the lesson and choose a view that makes the important feature easy to see. Drag to rotate, and use the on-screen controls to change one variable at a time. The Controls panel explains the available keyboard shortcuts.
Ask students to predict the result before you change a setting. Compare the new view with the starting state.
Guide the demonstration
Identify crust, root and solid mantle. Set the ice load to zero, then 3000 m. Predict the direction of motion.
Calculate 3000 × 917/3300 and compare the displayed depression. Switch to physical scale to see the vertical and horizontal dimensions at the same scale.
Discuss a common misconception
“Postglacial rebound shows that the mantle beneath the crust is liquid lava.” The mantle is predominantly solid rock but can deform slowly over long timescales. Removing an ice load changes the equilibrium supported by the underlying material, allowing the land to rise over time. An equilibrium-height model does not by itself calculate how fast that rebound occurs.
Build the explanation
Adding an ice load changes the equilibrium height of the crust. In the local Airy model, a denser mantle supports a less dense crustal column, and unloading raises its equilibrium position.
Calculate 3000 × 917/3300 and compare the displayed depression. Switch to physical scale to see the vertical and horizontal dimensions at the same scale.
The experiment calculates an equilibrium displacement; actual rebound takes time as the solid mantle deforms.
Teaching notes
Explain how the lithosphere responds to loading rather than treating the crust as resting on a rigid floor.
Describe the mantle as predominantly solid material that can flow slowly over long timescales.
Distinguish local changes in relative sea level caused by rebound from changes in global sea level.
Check understanding
Open Check for 4 questions. Ask students to explain their choice before revealing the answer.
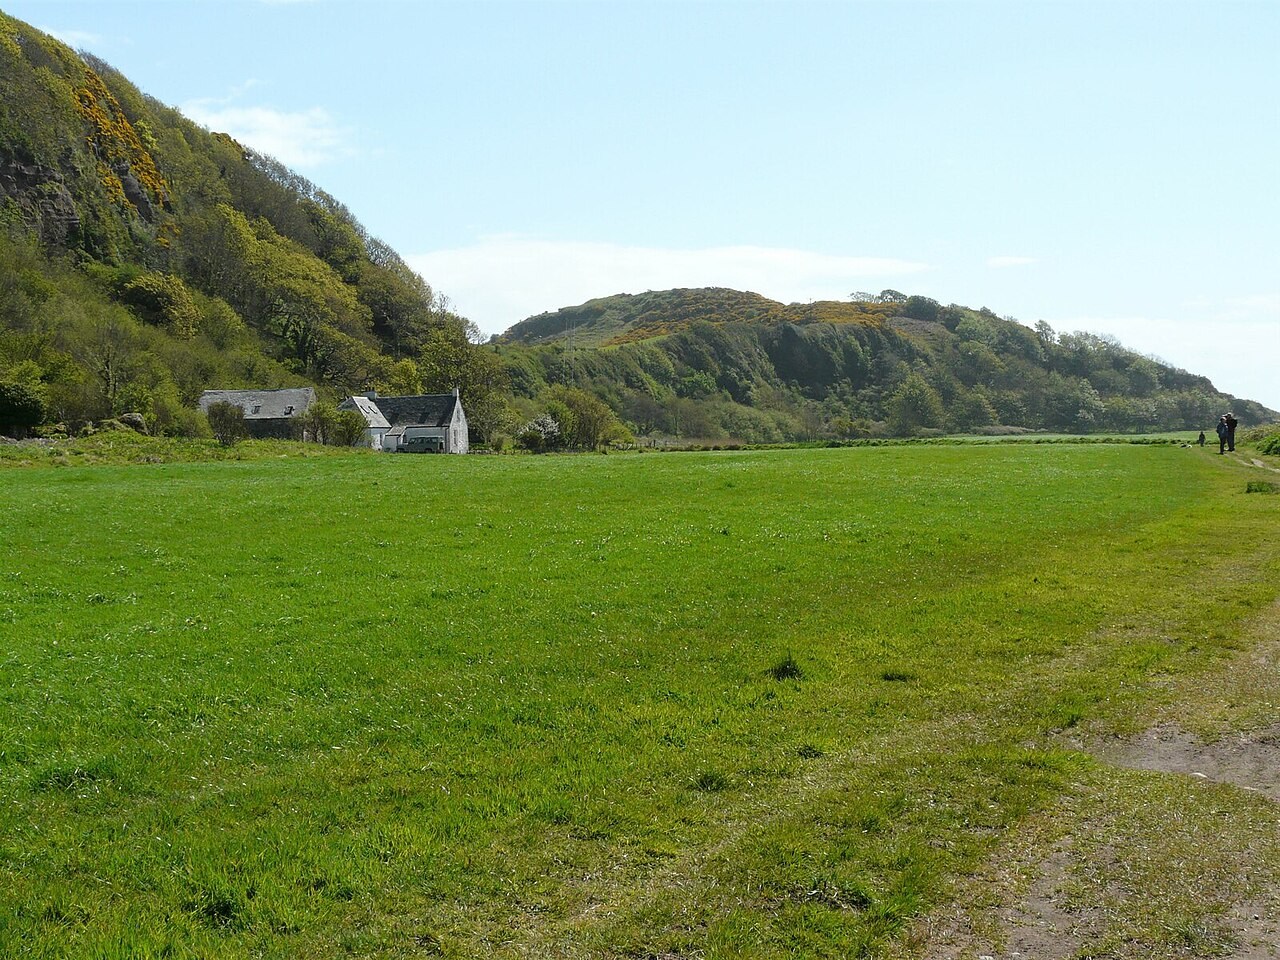
Return to the opening photograph. Ask students to identify one visible feature and explain which part of the model helps account for it.
Look more closely
Use these observations to connect the vocabulary to features students can identify.
Lithosphere
Root
Sources to keep beside the lesson
- BGS glacial rebound
- USGS / NRC Hudson Bay uplift
- BGS glacial isostatic adjustment