Teachers
A lesson for your classroom or geography club
Seafloor spreading
All teacher notes · Open the lab
A suggested lesson sequence
Use these stages at your own pace. Pause for students to sketch, compare observations or lead part of the demonstration.
01
Observe
Find the ridge axis and the two same-age endpoint labels. Set the full rate to 25 mm/year; calculate the 12.5 mm/year half rate.
02
Tinker
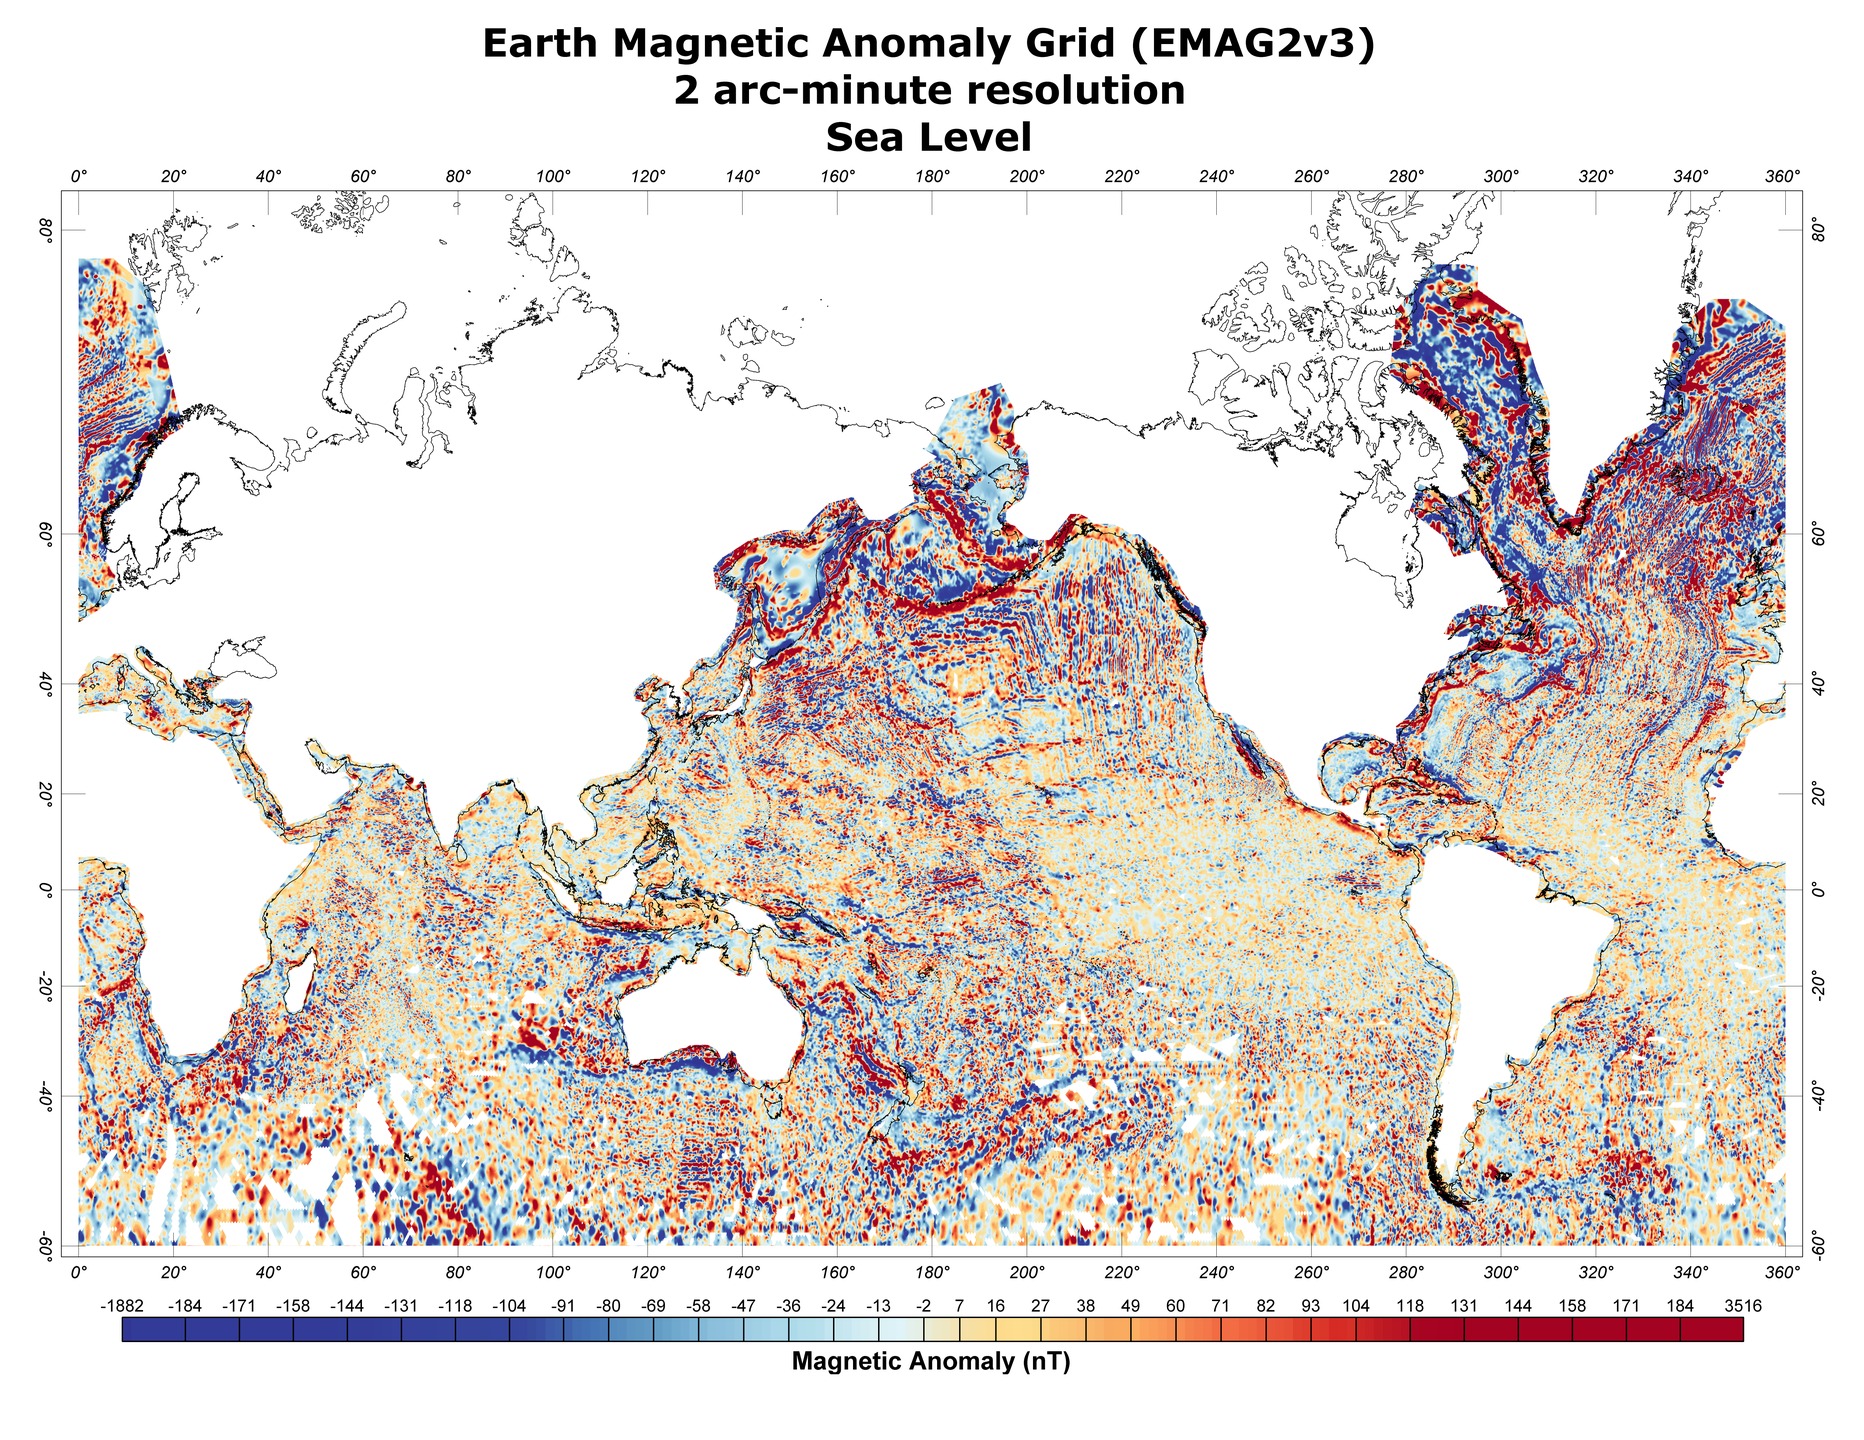
Play the magnetic reversal sequence and follow paired markers. Compare wider and narrower stripes without assuming a constant reversal period.
03
Explain
Why do matching magnetic stripes appear on opposite sides of a ridge, and what can their widths tell us?
04
Check
Choose an answer and explain your reasoning. Each question includes feedback.
Rehearse with the model
The same scene and controls as the lab. Load it when you are ready; use Start projector for the full classroom view.
Before the lesson
Explain how new oceanic crust forms at a ridge and how magnetic stripes record spreading on either side.
Open the model before the lesson and choose a view that makes the important feature easy to see. Drag to rotate, and use the on-screen controls to change one variable at a time. The Controls panel explains the available keyboard shortcuts.
Pause the animation at a useful moment. Ask students what should happen next, then play it to test their explanation.
Guide the demonstration
Find the ridge axis and the two same-age endpoint labels. Set the full rate to 25 mm/year; calculate the 12.5 mm/year half rate.
Play the magnetic reversal sequence and follow paired markers. Compare wider and narrower stripes without assuming a constant reversal period.
Discuss a common misconception
“Every magnetic stripe on the ocean floor represents the same amount of time.” Geomagnetic reversals occur at irregular intervals, and spreading rates can change. A stripe’s width depends on both the duration of its polarity interval and the rate at which crust moved away from the ridge. Matching sequences are stronger evidence than an assumption of equally spaced reversals.
Build the explanation
New oceanic crust forms at a spreading ridge and moves away on both sides. Its age generally increases with distance, while magnetic stripes record changes in Earth’s magnetic polarity.
Play the magnetic reversal sequence and follow paired markers. Compare wider and narrower stripes without assuming a constant reversal period.
The experiment uses a selected spreading history; real ridges change speed and can spread asymmetrically.
Teaching notes
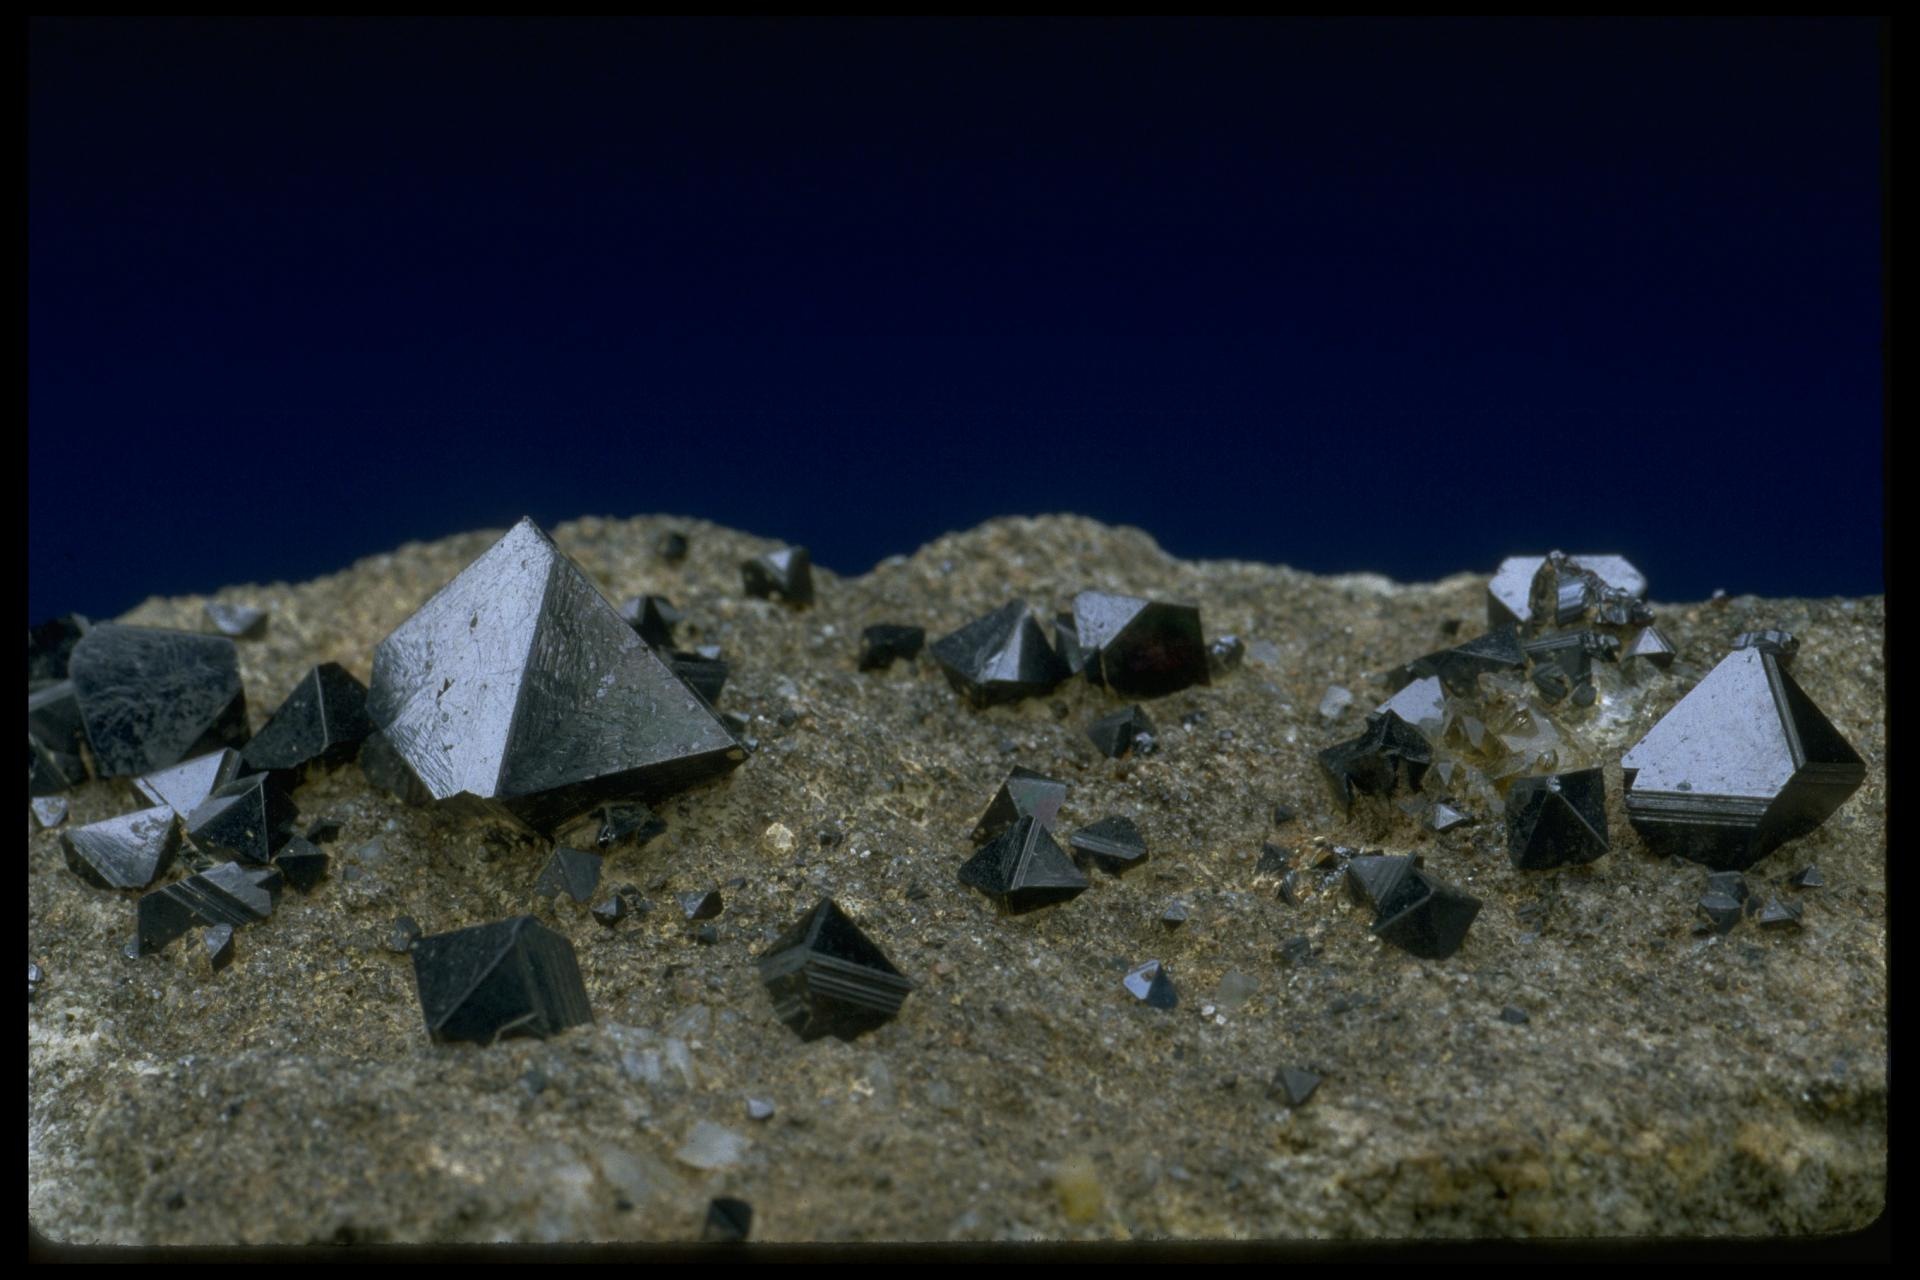
Explain magnetic stripes as records preserved in cooling crust, rather than as waves moving across the seabed.
Compare the age of crust on either side of the ridge, and distinguish spreading from movement along the San Andreas transform system.
Account for the model’s twelvefold vertical exaggeration when interpreting the shape of the ridge.
Check understanding
Open Check for 4 questions. Ask students to explain their choice before revealing the answer.
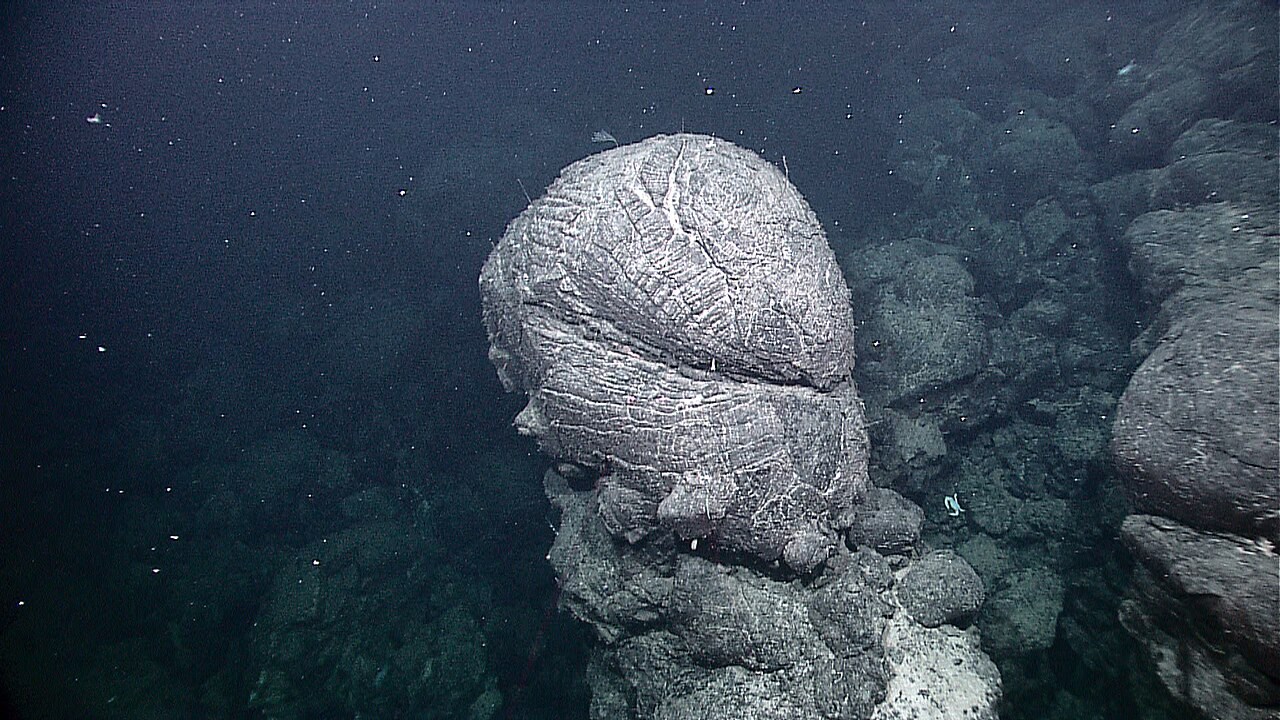
Return to the opening photograph. Ask students to identify one visible feature and explain which part of the model helps account for it.
Look more closely
Use these observations to connect the vocabulary to features students can identify.
Spreading rate
Curie point
Sources to keep beside the lesson
- USGS seafloor
- NOAA
- USGS spreading and magnetic evidence