Teachers
A lesson for your classroom or geography club
Storm surge
All teacher notes · Open the lab
A suggested lesson sequence
Use these stages at your own pace. Pause for students to sketch, compare observations or lead part of the demonstration.
01
Observe
Set wind and pressure drop to zero and identify the reference sea level. Raise Onshore wind and compare two shelf depths.
02
Tinker
Set wind to zero and isolate a pressure drop of 3000 Pa. Combine the effects, then compare physical scale to discuss geometric scale.
03
Explain
Why can the same onshore wind produce a larger rise in water level over a shallower shelf?
04
Check
Choose an answer and explain your reasoning. Each question includes feedback.
Rehearse with the model
The same scene and controls as the lab. Load it when you are ready; use Start projector for the full classroom view.
Before the lesson
Explain how strong winds and low atmospheric pressure can raise coastal water levels, especially over a shallow shelf.
Open the model before the lesson and choose a view that makes the important feature easy to see. Drag to rotate, and use the on-screen controls to change one variable at a time. The Controls panel explains the available keyboard shortcuts.
Ask students to predict the result before you change a setting. Compare the new view with the starting state.
Guide the demonstration
Set wind and pressure drop to zero and identify the reference sea level. Raise Onshore wind and compare two shelf depths.
Set wind to zero and isolate a pressure drop of 3000 Pa. Combine the effects, then compare physical scale to discuss geometric scale.
Discuss a common misconception
“A hurricane’s wind category fully describes its coastal flood threat.” Coastal water rise also depends on storm size, track, duration, atmospheric pressure and the shape and depth of the coast. Tide, waves and river flow further affect flooding. A wind category therefore cannot specify the water level or inundation at a particular location.
Build the explanation
Onshore winds push water towards the coast, while lower atmospheric pressure also raises the water surface. Shallow shelves can produce a larger setup for the same forcing.
Set wind to zero and isolate a pressure drop of 3000 Pa. Combine the effects, then compare physical scale to discuss geometric scale.
This steady shelf experiment excludes tides, waves and inundation, which are needed to assess a real coastal flood.
Teaching notes
Distinguish storm surge from a tsunami by explaining the process that raises the water level.
Consider wind-driven water accumulation and atmospheric pressure as well as waves on the surface.
Use water depth and coastal shape to explain why shallow shelves and narrowing bays can amplify a surge.
Check understanding
Open Check for 4 questions. Ask students to explain their choice before revealing the answer.
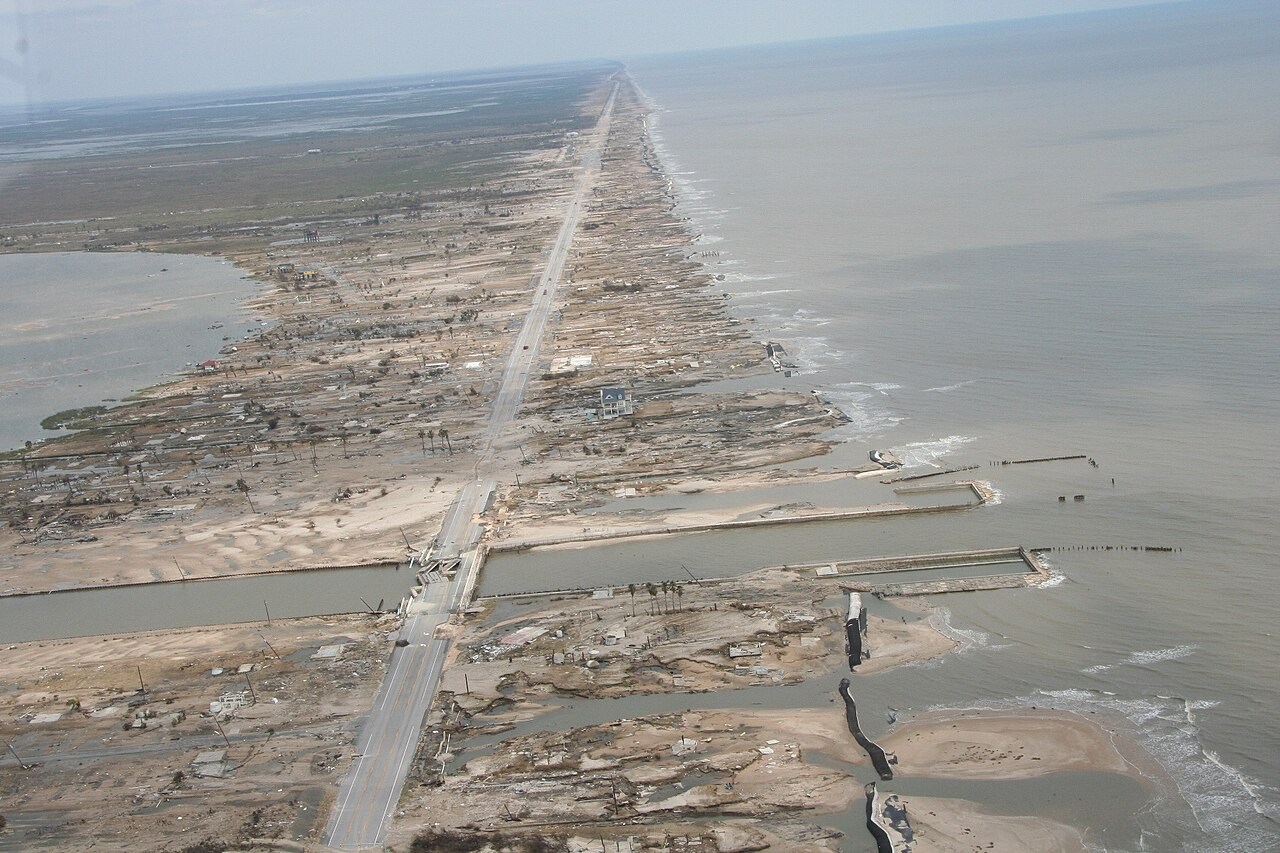
Return to the opening photograph. Ask students to identify one visible feature and explain which part of the model helps account for it.
Look more closely
Use these observations to connect the vocabulary to features students can identify.
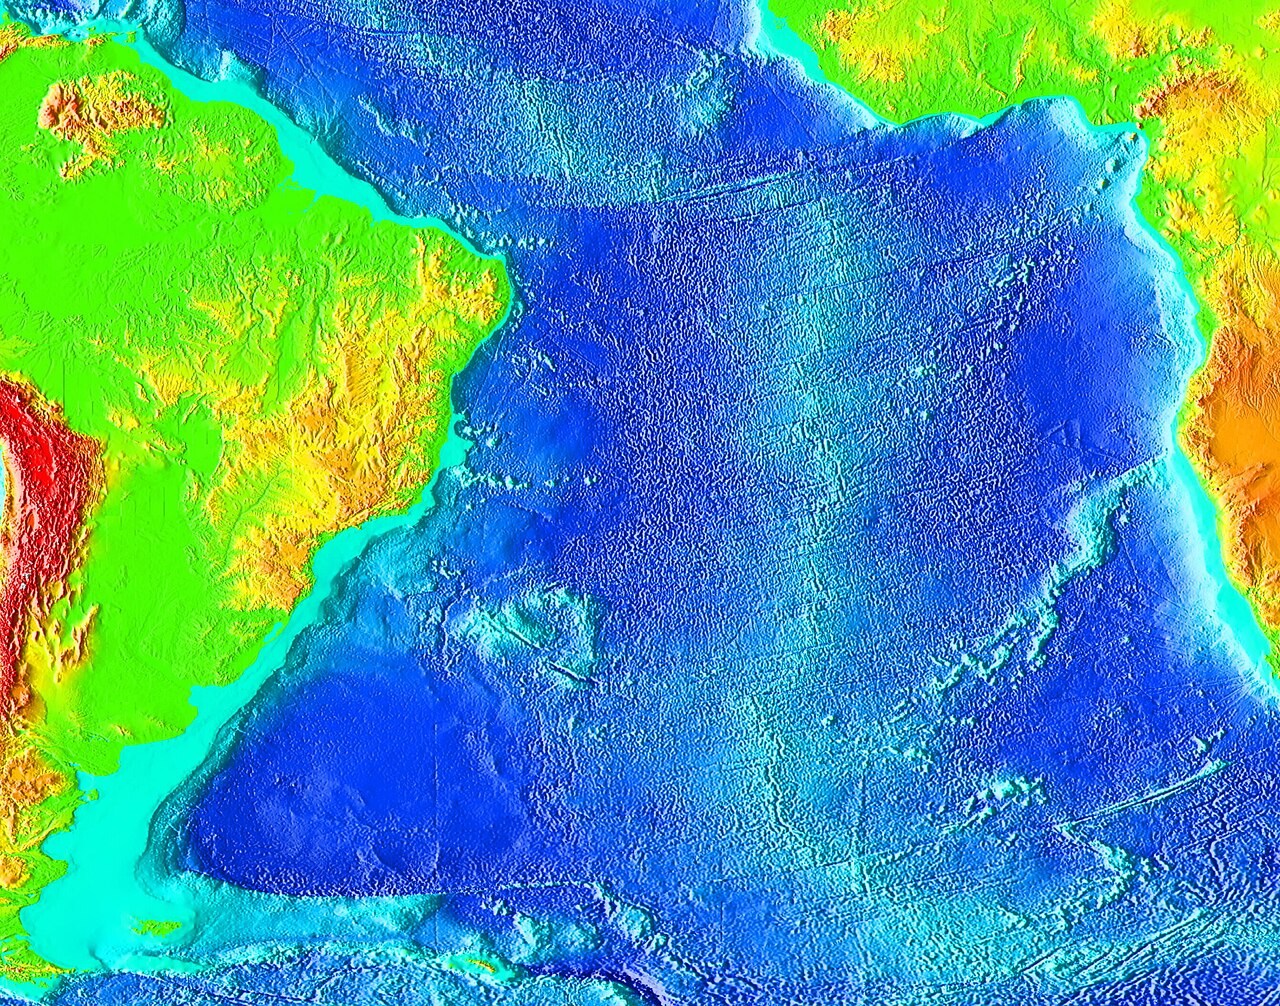
Shelf
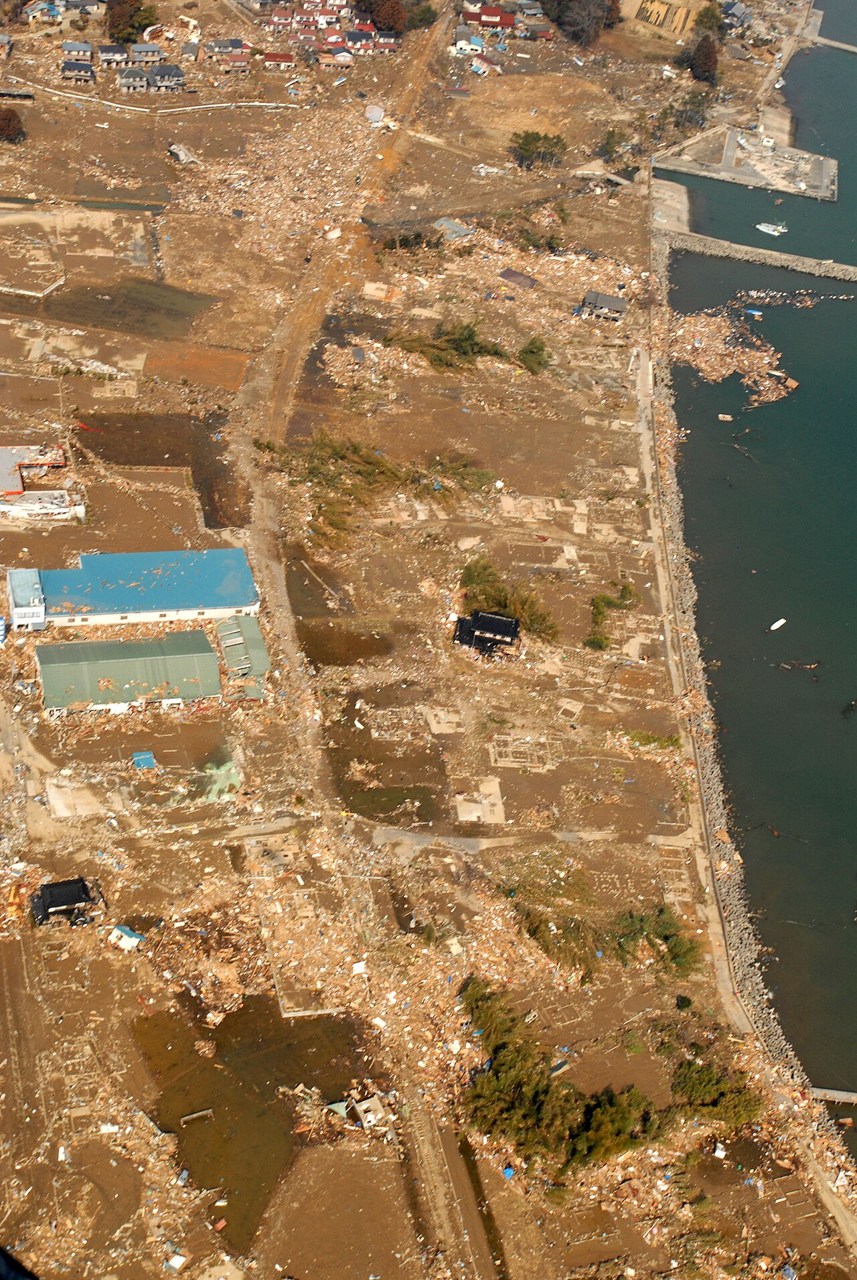
Tsunami
Sources to keep beside the lesson
- Met Office / EA 1953
- NOAA / NHC storm surge
- NOAA storm surge overview