Teachers
A lesson for your classroom or geography club
Climate types
All teacher notes · Open the lab
A suggested lesson sequence
Use these stages at your own pace. Pause for students to sketch, compare observations or lead part of the demonstration.
01
Observe
Read the A–E legend and identify the highlighted family on the globe.
02
Tinker
Choose Tropical, then Dry. Compare their distribution and explain why temperature alone cannot separate them.
03
Explain
Why must rainfall be considered alongside temperature when comparing tropical and dry climates?
04
Check
Choose an answer and explain your reasoning. Each question includes feedback.
Rehearse with the model
The same scene and controls as the lab. Load it when you are ready; use Start projector for the full classroom view.
Before the lesson
Explore the five major climate families and explain how long-term temperature and rainfall patterns shape their global distribution.
Open the model before the lesson and choose a view that makes the important feature easy to see. Drag to rotate, and use the on-screen controls to change one variable at a time. The Controls panel explains the available keyboard shortcuts.
Ask students to predict the result before you change a setting. Compare the new view with the starting state.
Guide the demonstration
Choose Tropical and ask students to describe where it occurs. Then choose Dry and discuss why rainfall matters as well as temperature.
Locate London as a temperate example, then compare Helsinki and Nuuk. Ask students why a city’s classification should not be assigned to its whole country.
Finish by distinguishing climate from today’s weather. Discuss why vegetation also depends on soil, land use and disturbance, then use Check to test the explanation.
Discuss a common misconception
“One unusual day of weather can change a place’s climate classification.” Climate classifications use long-term patterns, such as monthly temperature and precipitation statistics. A heatwave or wet day is an event within that distribution. Classifying a place therefore requires a representative record, while a longer-lasting shift in the statistics may eventually change its classification.
Build the explanation
Köppen–Geiger groups climates using long-term monthly temperature and rainfall. Tropical, dry, temperate, continental and polar families describe different combinations of warmth, seasonality and moisture.
Select a family below the globe, then rotate Earth to compare where it occurs. The marked city gives one local example; nearby coasts and highlands may have a different class.
The colours summarise the 1991–2020 reference period; a location’s climate class does not determine its current weather or exact vegetation.
Teaching notes
Use long-term temperature and rainfall patterns to explain climate classes rather than treating them as today’s weather.
Keep a reference point’s climate separate from the range of climates found across a whole country.
Explain that a climate family can support several vegetation types and does not determine one unique biome.
Check understanding
Open Check for 4 questions. Ask students to explain their choice before revealing the answer.
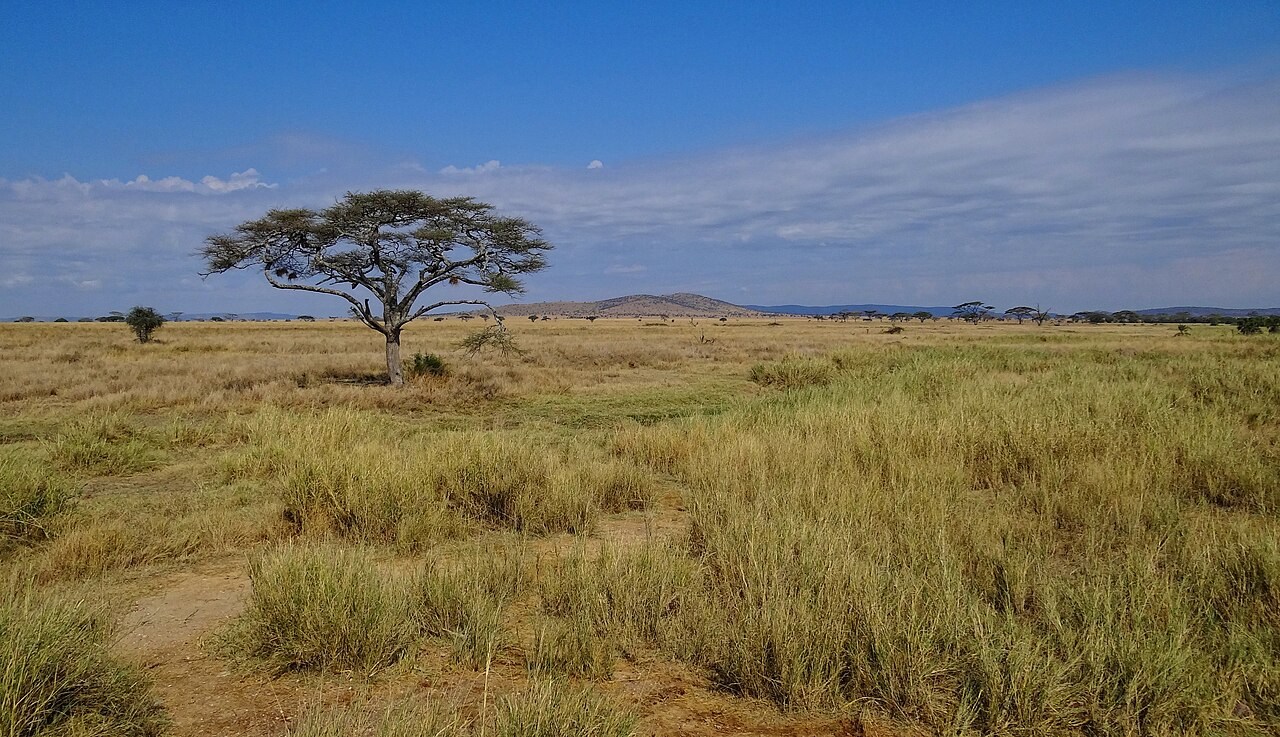
Return to the opening photograph. Ask students to identify one visible feature and explain which part of the model helps account for it.
Look more closely
Use these observations to connect the vocabulary to features students can identify.
Köppen
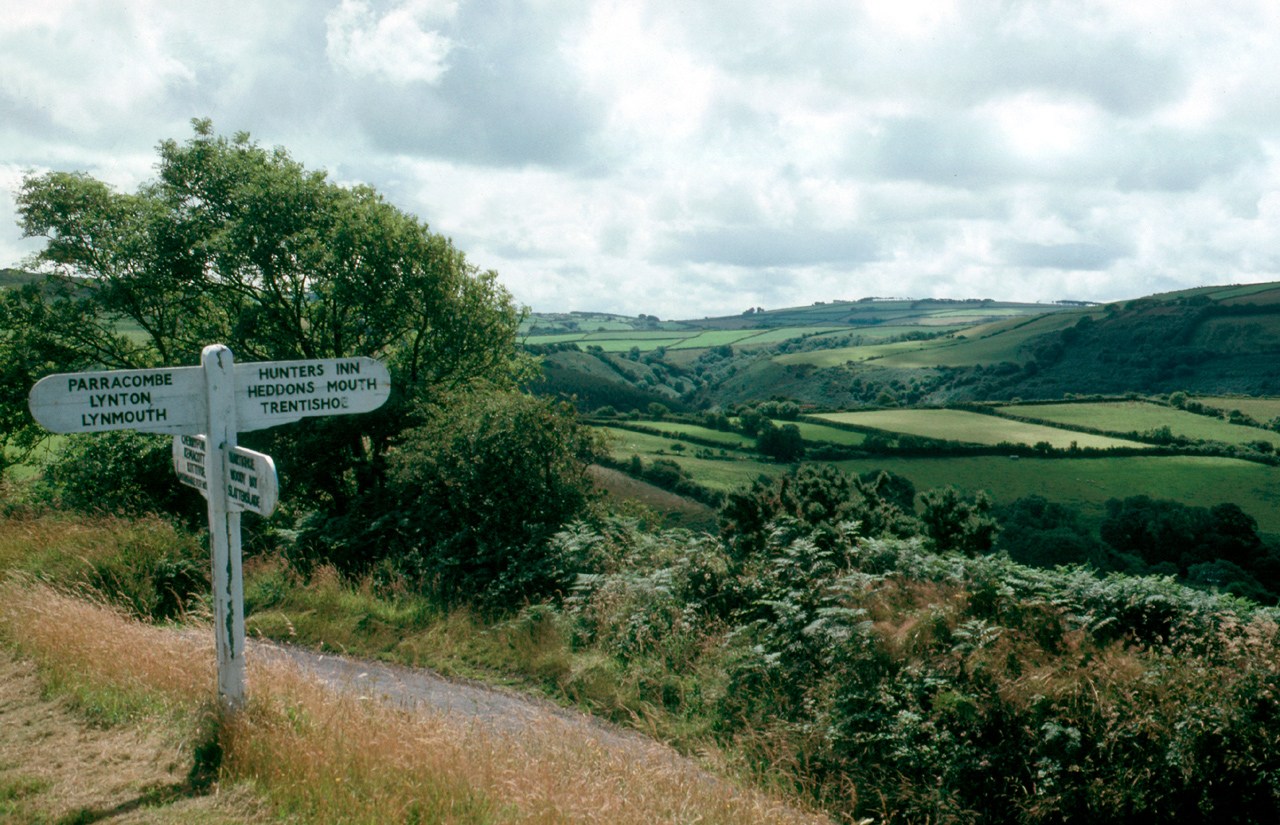
BWh