Teachers
A lesson for your classroom or geography club
Sun and Earth
All teacher notes · Open the lab
A suggested lesson sequence
Use these stages at your own pace. Pause for students to sketch, compare observations or lead part of the demonstration.
01
Observe
At zero declination compare the equator, 60° and a pole.
02
Tinker
Change declination to each solstice limit and compare noon with daily mean.
03
Explain
Why can two places receive different amounts of solar energy even on the same day?
04
Check
Choose an answer and explain your reasoning. Each question includes feedback.
Rehearse with the model
The same scene and controls as the lab. Load it when you are ready; use Start projector for the full classroom view.
Before the lesson
Explain how latitude and the Sun’s declination affect the solar energy received at noon and across a whole day.
Open the model before the lesson and choose a view that makes the important feature easy to see. Drag to rotate, and use the on-screen controls to change one variable at a time. The Controls panel explains the available keyboard shortcuts.
Ask students to predict the result before you change a setting. Compare the new view with the starting state.
Guide the demonstration
At zero declination compare the equator, 60° and a pole.
Change declination to each solstice limit and compare noon with daily mean.
Discuss a common misconception
“Sunlight above the atmosphere supplies the same energy to every square metre of ground.” The angle of the rays changes how incoming energy is spread over a horizontal surface. At a lower Sun angle the same beam covers more ground, and day length also changes daily energy receipt. Clouds, reflection and atmospheric absorption further modify the energy reaching the surface.
Build the explanation
The same sunlight spreads across a larger area when it strikes a surface at a shallow angle. Latitude, solar declination and day length therefore affect the energy received by a horizontal surface.
Change declination to each solstice limit and compare noon with daily mean.
The calculation describes sunlight above the atmosphere; clouds and atmospheric absorption would change the energy reaching the ground.
Teaching notes
Distinguish sunlight measured perpendicular to a beam from energy received by a horizontal surface.
Include the night-time interval when interpreting a daily average of incoming solar energy.
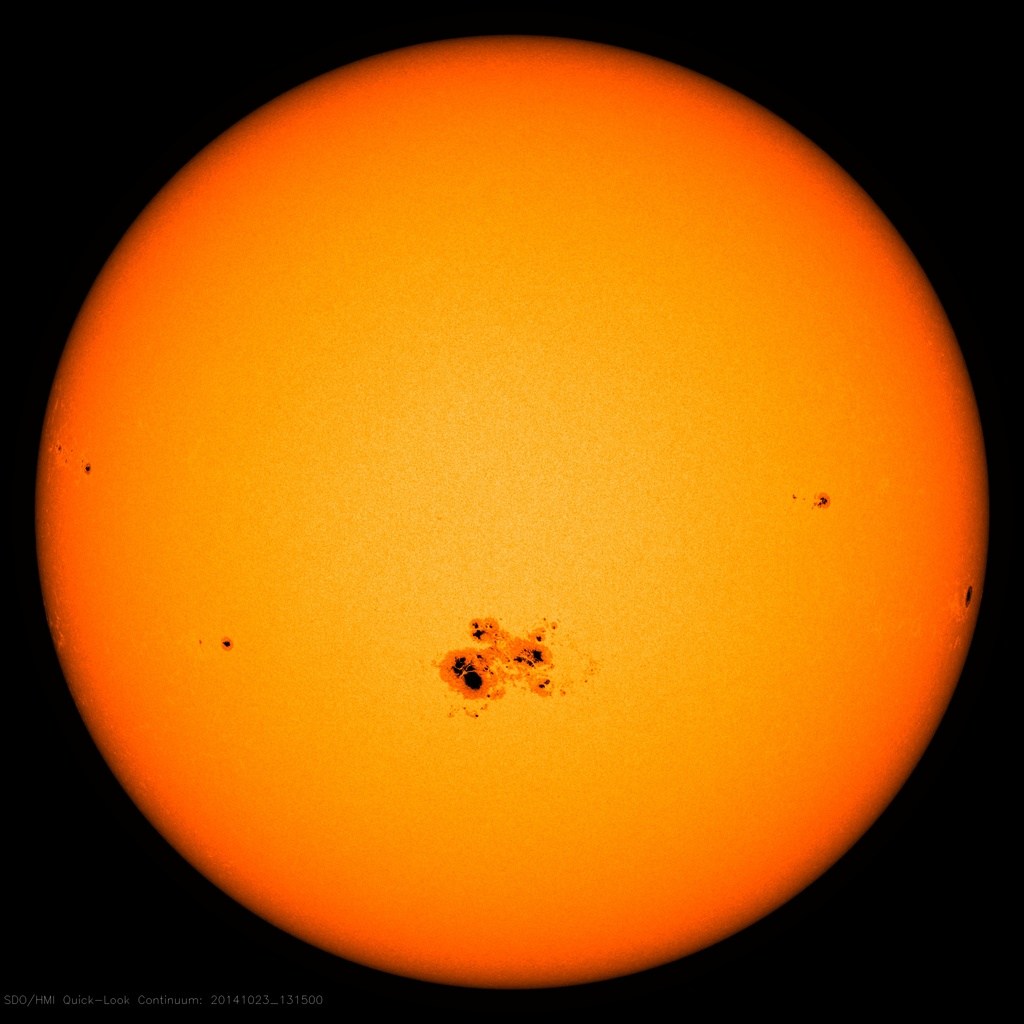
Explain the seasons through Earth’s axial tilt rather than changes in visible sunspots.
Check understanding
Open Check for 4 questions. Ask students to explain their choice before revealing the answer.
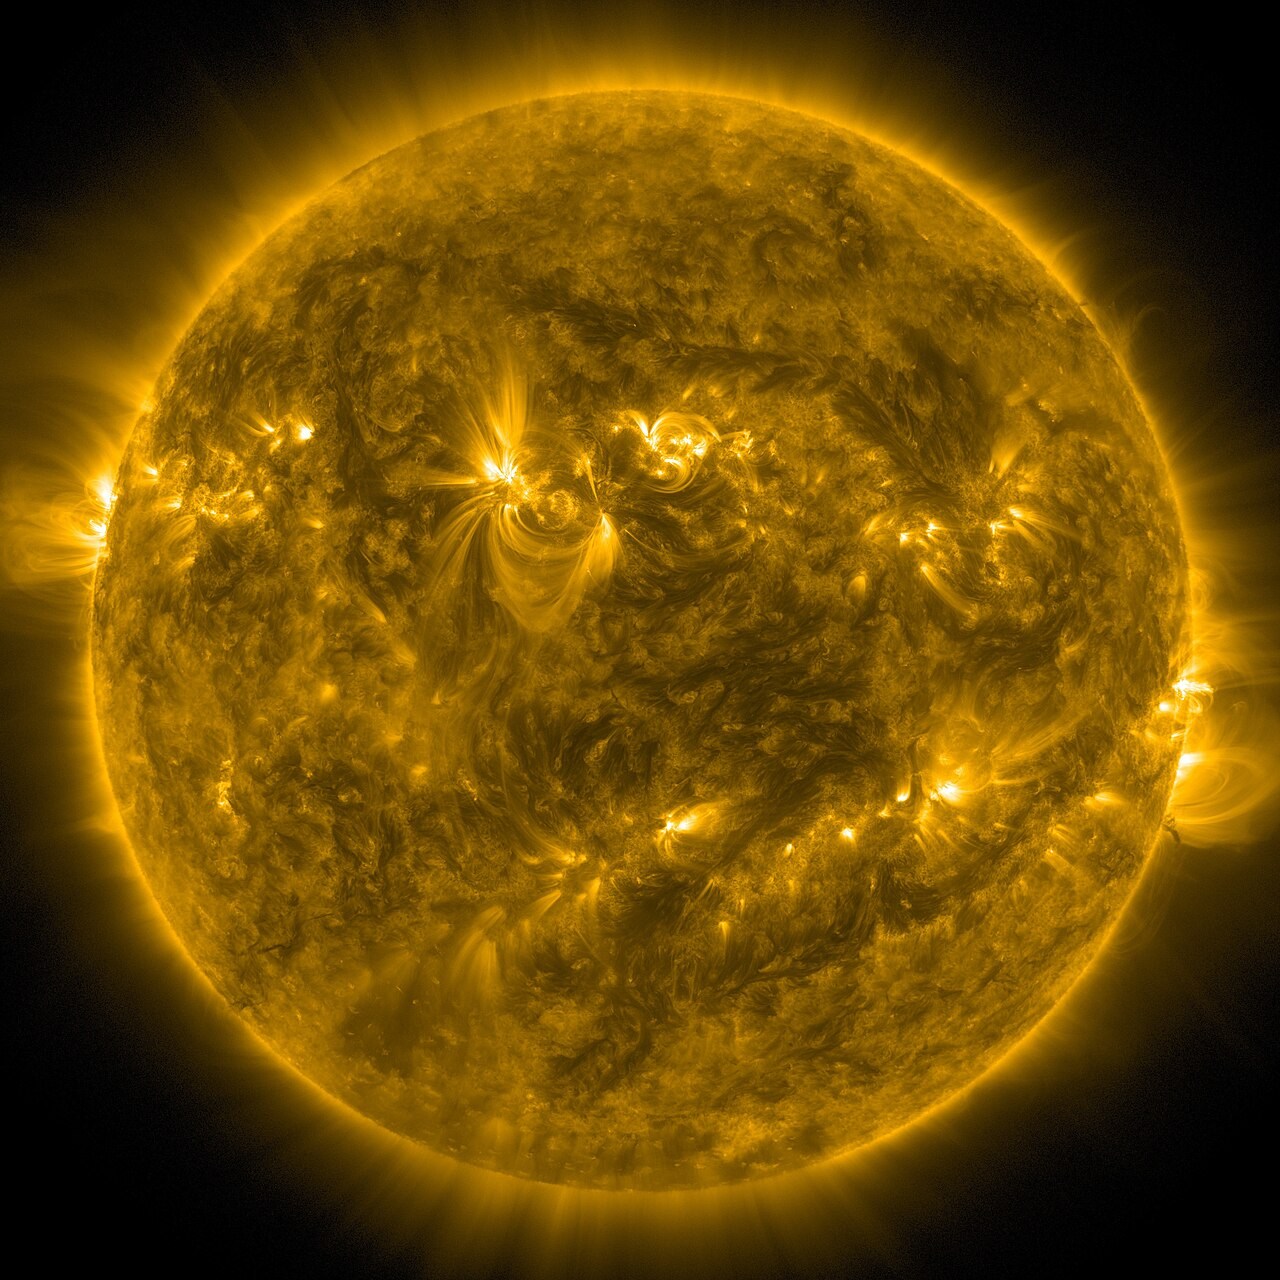
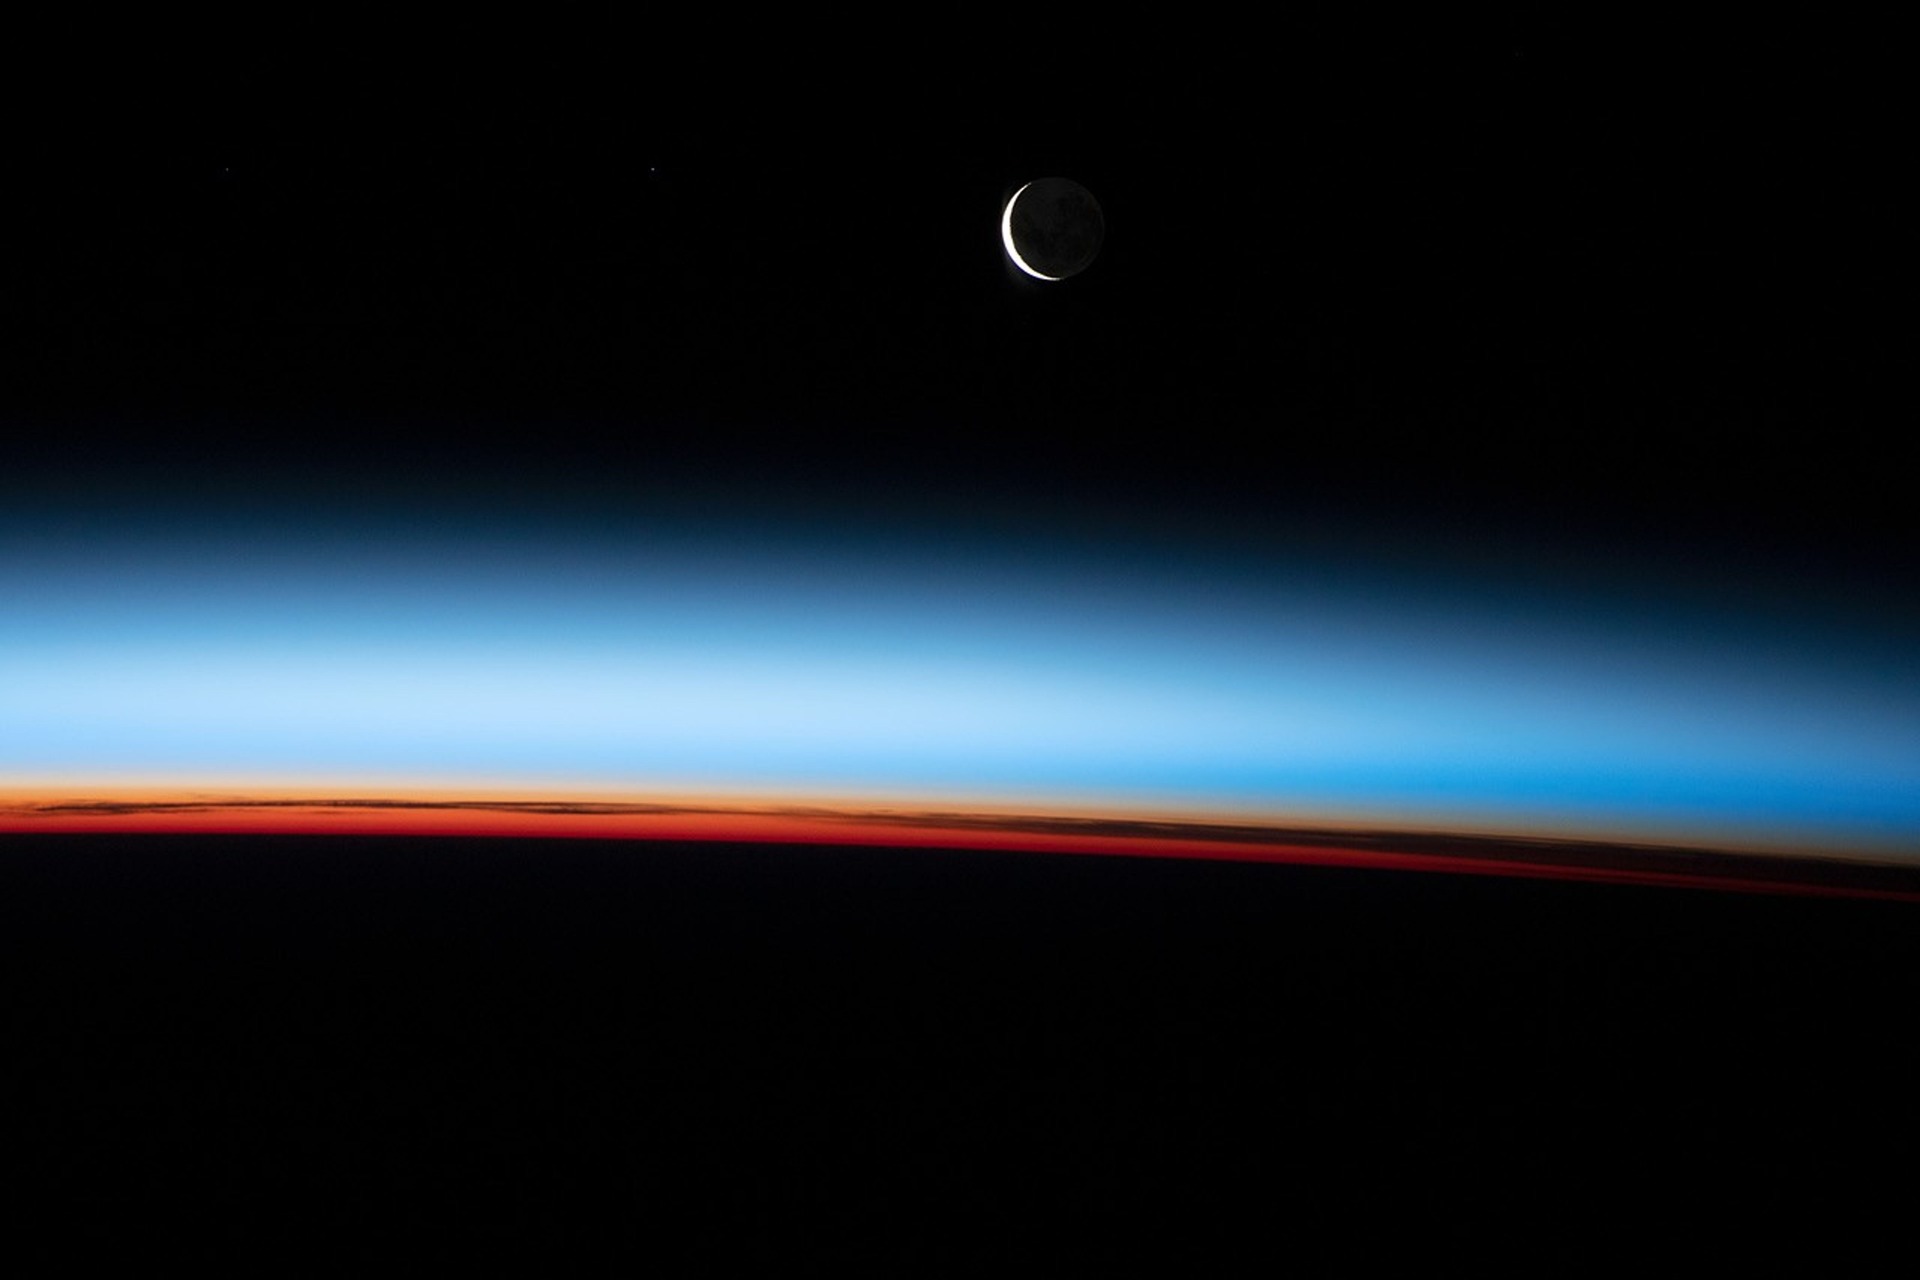
Return to the opening photograph. Ask students to identify one visible feature and explain which part of the model helps account for it.
Look more closely
Use these observations to connect the vocabulary to features students can identify.
Solar constant
Incidence
Sources to keep beside the lesson
- NASA / NOAA solar
- NASA solar irradiance reference